"VolumPro" - Description of the program for searching trading situations in cryptocurrency markets
Warning
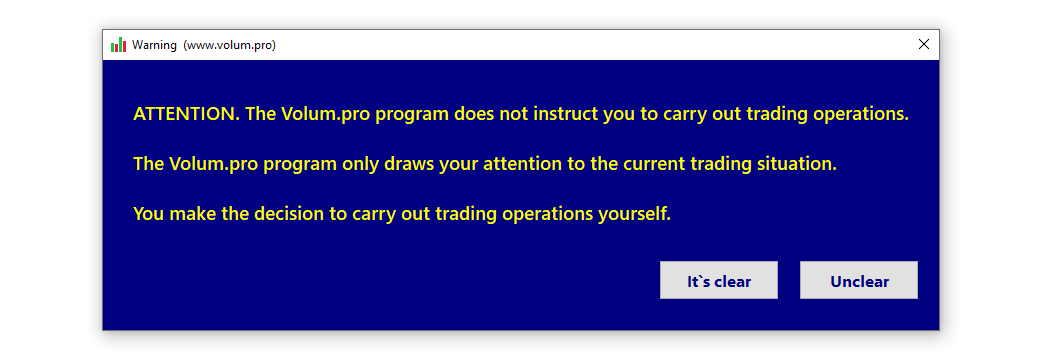
ATTENTION. The Volum.pro program does not instruct you to carry out trading operations. The Volum.pro program only draws your attention to the current trading situation. You make the decision to carry out trading operations yourself.
Basic Concepts
Everyone wants to know the future, and traders especially want it; they will even be satisfied with the near future. At the same time, looking at price charts for a long time without stopping is very boring. Looking at several charts at the same time is an almost impossible task. Nobody knows where the price will go, and traders make decisions by calculating probabilities. But when the price stops being dormant and begins to wake up, then you can catch this moment in time and not overlook a good trading situation. And if at the same time the necessary patterns appear and the indicators give confirming signals, then it will be much easier to make a trading decision at such a moment. The tool for such work is provided on this website. The computer program "Volum.pro” simultaneously monitors up to 60 trading cryptocurrency pairs and identifies a favorable trading situation for each of them. The Volum.pro program has current data from 60 cryptocurrency exchanges at its disposal. You independently make a decision about where to open a trade by analyzing large charts, and the Volum.pro program will be your advisor, who will answer the question "when to enter the market” and give a timely signal that you urgently need to pay attention to such it is a trading tool. The program can also show history - when a trading signal would have been sent and whether it justified its purpose. In addition to its main task, the Volum.pro program can also solve additional problems. It can show lagging and leading coins, and can also show current arbitrage situations for a selected pair on different trading platforms.
Appearance of the program
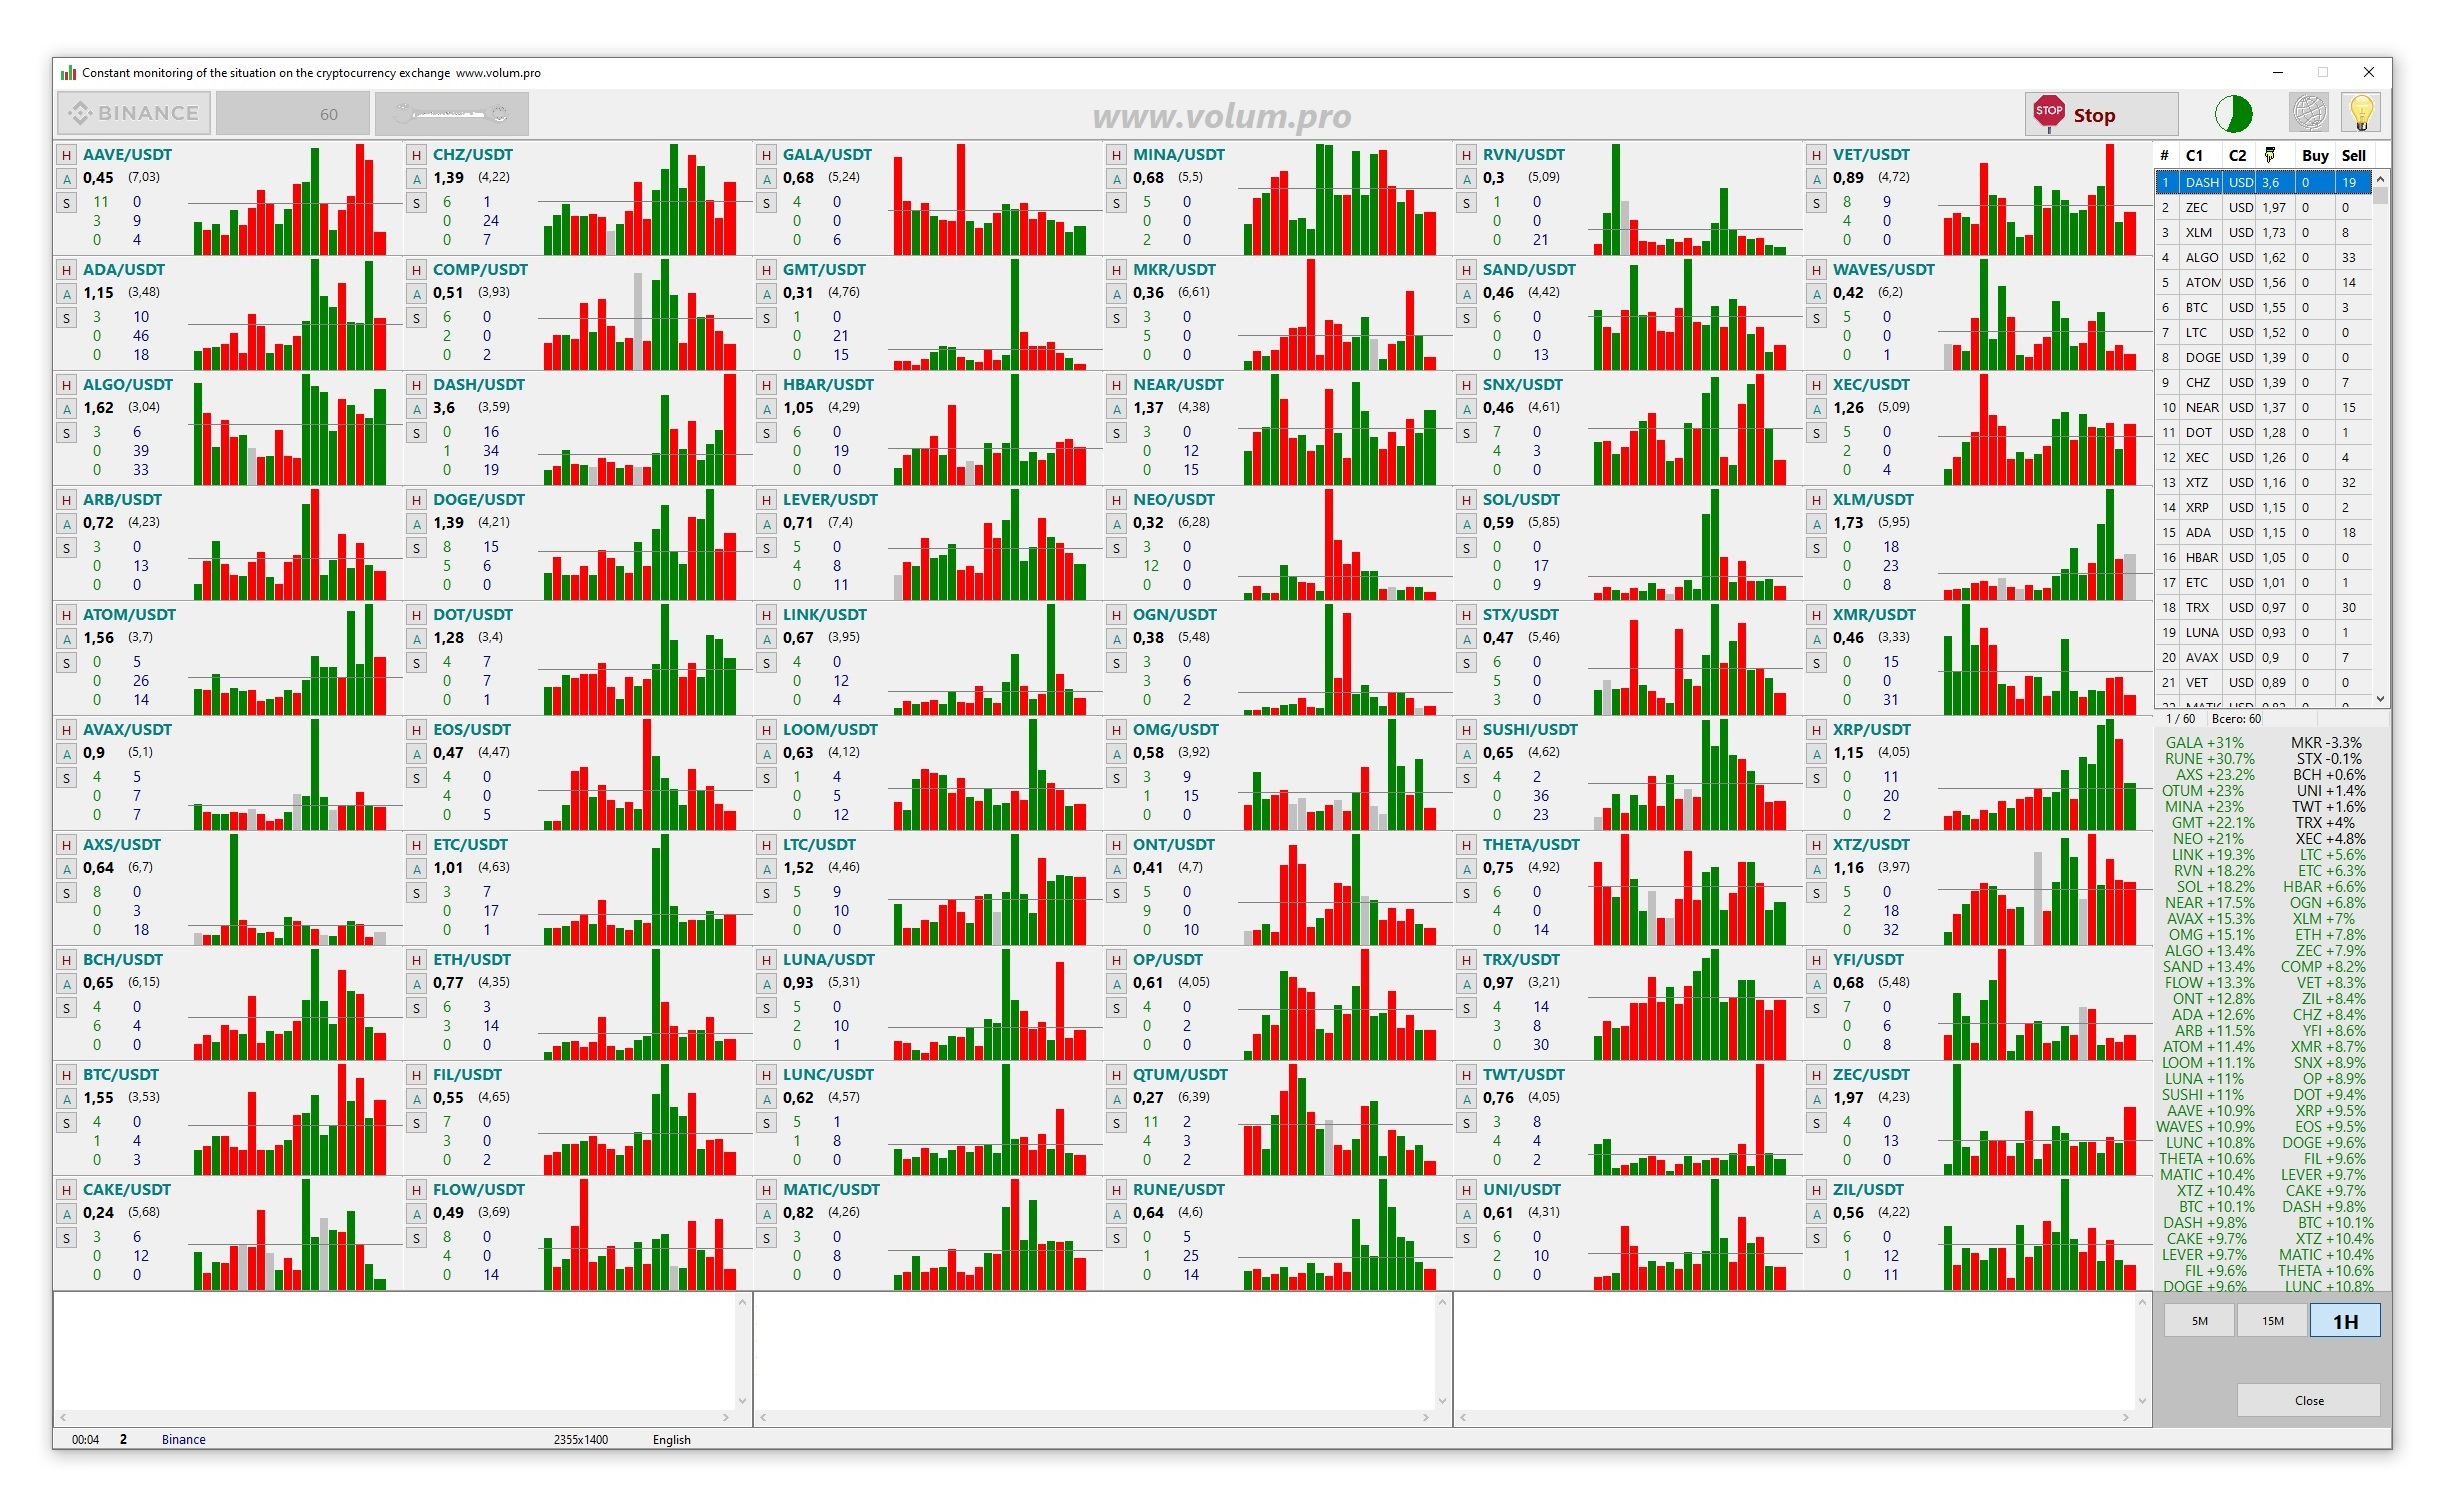
At the top of the working window there are buttons for setting up and controlling the program. Button for selecting tradable cryptocurrency pairs. General settings button. Button to Start and Stop the program execution process. Time indicator. Language selection button. Button to turn hints on and off. In the central part of the program window there are several fields separately for each cryptocurrency pair. Each of these fields contains three control buttons. History button, arbitration button and status button. These buttons open additional information windows on their topics. This is written below. The names of the cryptocurrency pair and the value of the volume impulse on the last candle of the selected period are also located here. The calculated normal value of the volume impulse for the selected period is indicated in brackets. The program monitors three periods - five minutes, fifteen minutes and one hour. You can switch between periods at any time. The numbers three green and three blue are also located here. The first green number reflects the number of buy signals on the five-minute chart. The second green number reflects the number of buy signals on the fifteen-minute chart. The third green number reflects the number of buy signals on the hourly chart. The blue numbers in the same order reflect sell signals. Well, and of course, the volume chart of the last twenty candles. The horizontal thin line is the average volume of the last twenty candles. If the volume on the last candle is below the average value, then the volume momentum of the last candle is less than one. At the top right is a summary table of all current results. The table can be sorted by columns. At the right center is an indicator showing the local meaning of fear and greed. It is calculated based on the sum of all cryptocurrency pairs under consideration. Details of its calculation will be below. At the bottom right is a list of leading coins and lagging coins. The principle of these calculations is described below. At the very bottom there are buttons for switching between periods. At the bottom of the program window there are three text fields. The left field records all program actions. The central field records all trading situations in a row. The right field contains a record of the best trading situations that you should pay attention to immediately. Double-clicking on each field will expand the entries in the text file. At the very bottom of the program there is a general information line.
Selecting instruments for trading
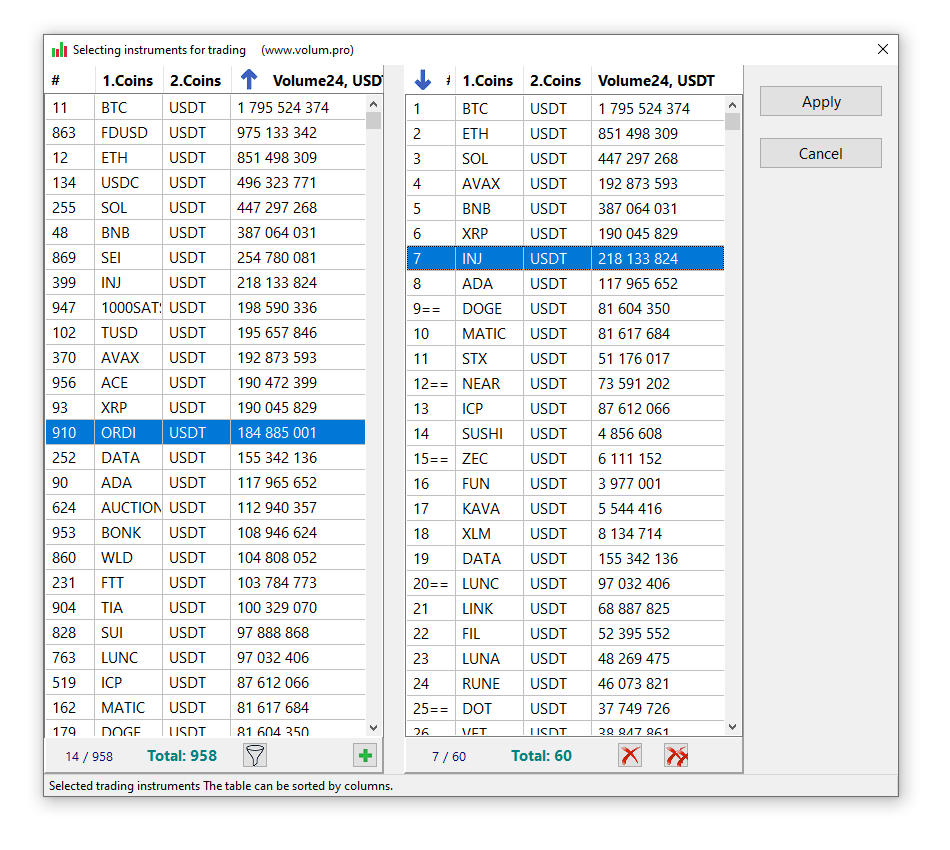
The Binance cryptocurrency exchange was taken as a basis, since it is considered the largest exchange in terms of the range of trading instruments and in terms of trading volume. This does not mean that you must necessarily trade on this exchange. On the left is a list of tradable cryptocurrency pairs on the Binance exchange. You need to choose your pairs from this list. You can select up to 60 pairs. To make your choice easier, information about the trading volume for the last 24 hours for each pair is provided. The selected pairs are displayed in the table on the right. The right table can be easily edited by adding and deleting records in it. Both tables can be sorted by columns. To make it easier to find the right trading pairs, a filter is provided in the left table. To fully understand the information, a hint for each field is displayed at the very bottom line of this window.
General settings
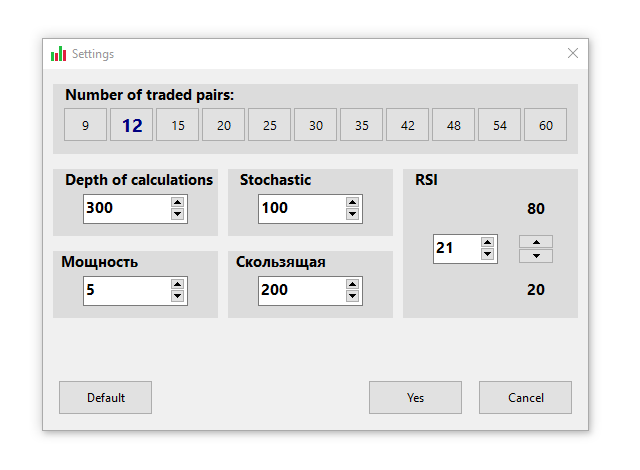
In this window you can select the number of cryptocurrency pairs to be traded. Also in this window you can change more complex settings: the depth of calculations, the power of calculations, the period of the "Stochastic” indicator, the period of the moving average and the settings of the "RSI” indicator. At the initial stage, it will be enough to use only the change in the number of traded cryptocurrency pairs. The rest of the calculation settings can be left as default and returned to them later.
Beginning of work
The operating principles of the Volum.pro program are to monitor several markets simultaneously and if good trading situations arise, the program will give a signal. In the meantime, while the program is running, at this moment you can calmly do other things and only have to look at the graph in rare moments. Thus, we can say that by purchasing this program, you buy yourself time for your personal life, while you will always be aware of current events in the market. When all cryptocurrency pairs are selected and all settings are set, then use the Start button to launch the "VolumPro” program. The first few minutes of work will involve preliminary data collection for each cryptocurrency pair. If a couple is participating in the work for the first time, then obtaining preliminary data on it will take a little longer than usual. After receiving preliminary data for each cryptocurrency pair under study, the program will begin to receive new price chart data every five minutes. The time indicator in the upper right corner of the program will tell you when the next price scanning will start. The "VolumPro” program receives all data from the Binance cryptocurrency exchange, for the reason already described just above. After receiving all the data, there is a calculation and search for trading signals that help determine favorable conditions for making trading decisions. Let's list all the trading signals that the "Volum.pro" program will monitor: volume impulse, candle body density, long candle shadow, dominant group of shadows on the last candles, long candle, divergence / convergence on the "RSI" indicator, divergence / convergence on "MACD" indicator and the last signal is the price extreme - the 'Stochastic' indicator. There are only 8 trading signals and each signal separately means nothing, but when they come together and signal one direction of price movement, then this increases the likelihood of price movement in the indicated direction. Let's look at the trading situation for the "ETCUSDT” cryptocurrency pair as an example.
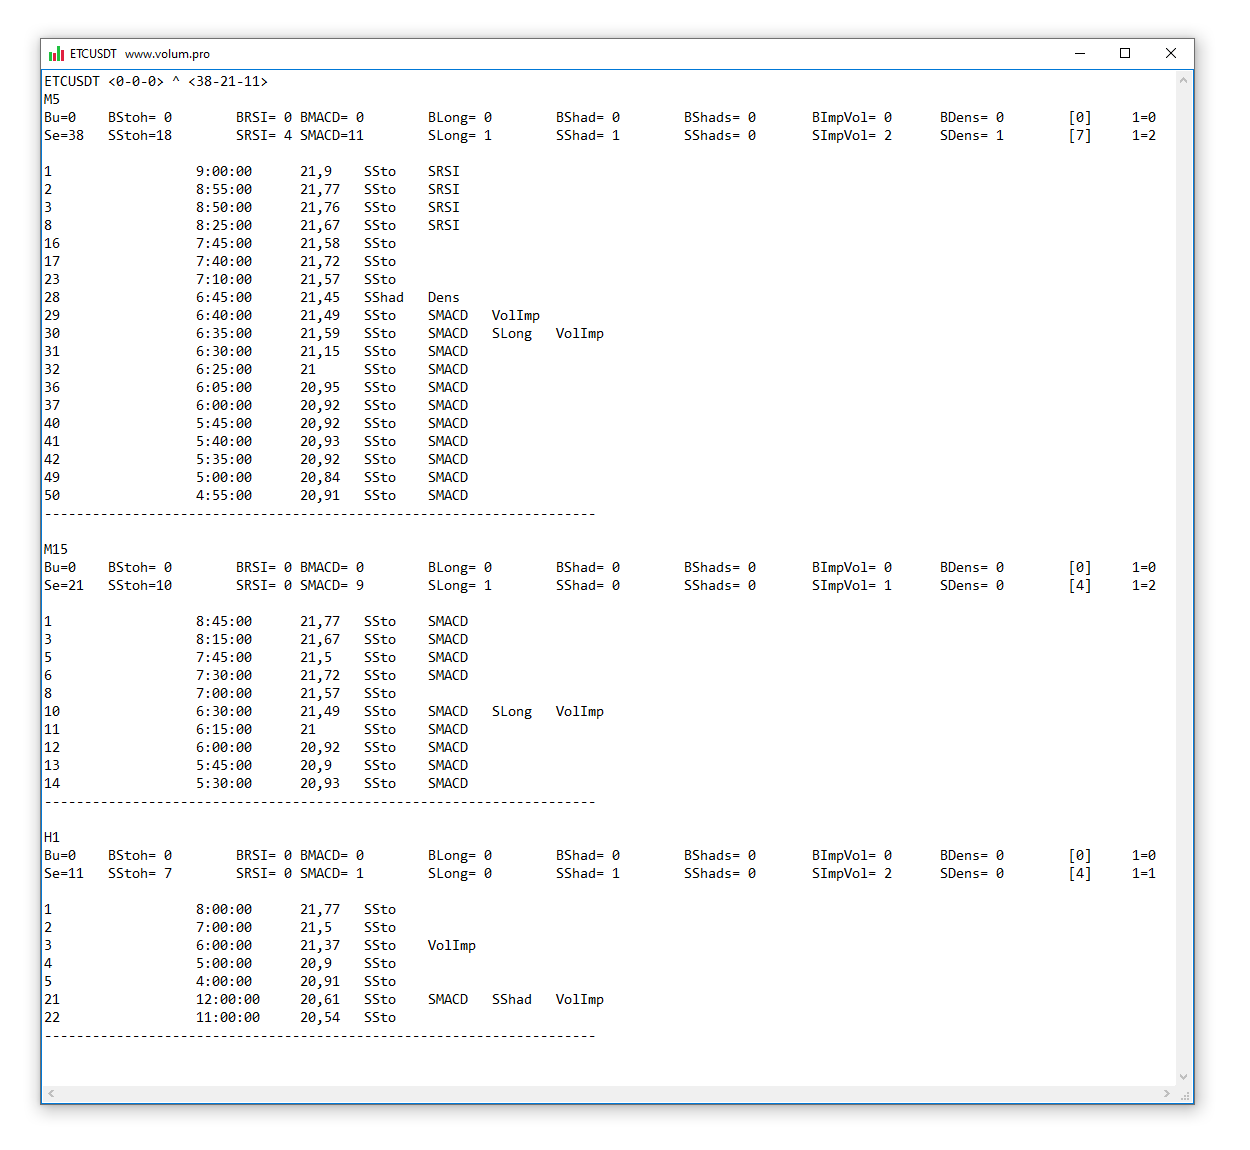
The first line informs which cryptocurrency we are currently considering and shows six digits with the number of signals. The first three digits are all zeros. This means that there is not a single Buy trading signal in all three periods. But the next three numbers show that there are sell signals. On a five-minute period over the last 50 candles (50 is an accepted constant), there are 38 sell signals. There are 21 sell signals on a fifteen-minute period. There are 11 sell signals on the hourly period. Looking at this situation, we can say that the probability of the price moving in the expected direction is very high. We can also say that the more signals point in one direction, the more likely the price will move in that direction. This is exactly what traders look for when making trading decisions - probability. For some traders, even such a small probability <20-15-5> is enough, and one can quite agree with this approach if there is a confident trend in the market, and these signals indicate the direction of the price towards this stable trend. The second line indicates the period. The third line shows summary information on all Buy signals. The fourth line shows summary information on all Sell signals. Let's look at the fourth line in detail. The total sum of all sell signals (Se=38). Number of sell signals from the "Stochastic” indicator (SStoh=18). The number of sell signals (divergences) from the "RSI” indicator (SRSI=4). The number of sell signals (divergences) from the "MACD” indicator (SMACD=11). The number of sell signals depends on the length of the candle (SLong=1). The number of sell signals depends on the size of the candle shadow (SShad=1). The number of sell signals from the group of shadows of the last candles (SShads=0). Number of sell signals from volume impulses (SImpVol=2). The number of sell signals depends on the density of the candle body (SDens=1). Of the eight signals monitored, seven types of signals were involved in the last 50 candles ([7]). There are two signals on the last candle (1=2). Below are lines with detailed information for each signal candle. The first digit is the candle number. (The last formed candle is number 1, the penultimate candle is number 2, and so on). Then the opening time of the candle is displayed. Then the closing price of the candle is displayed. Then the signals on this candle are listed. For the remaining periods everything is identical.
History of signals
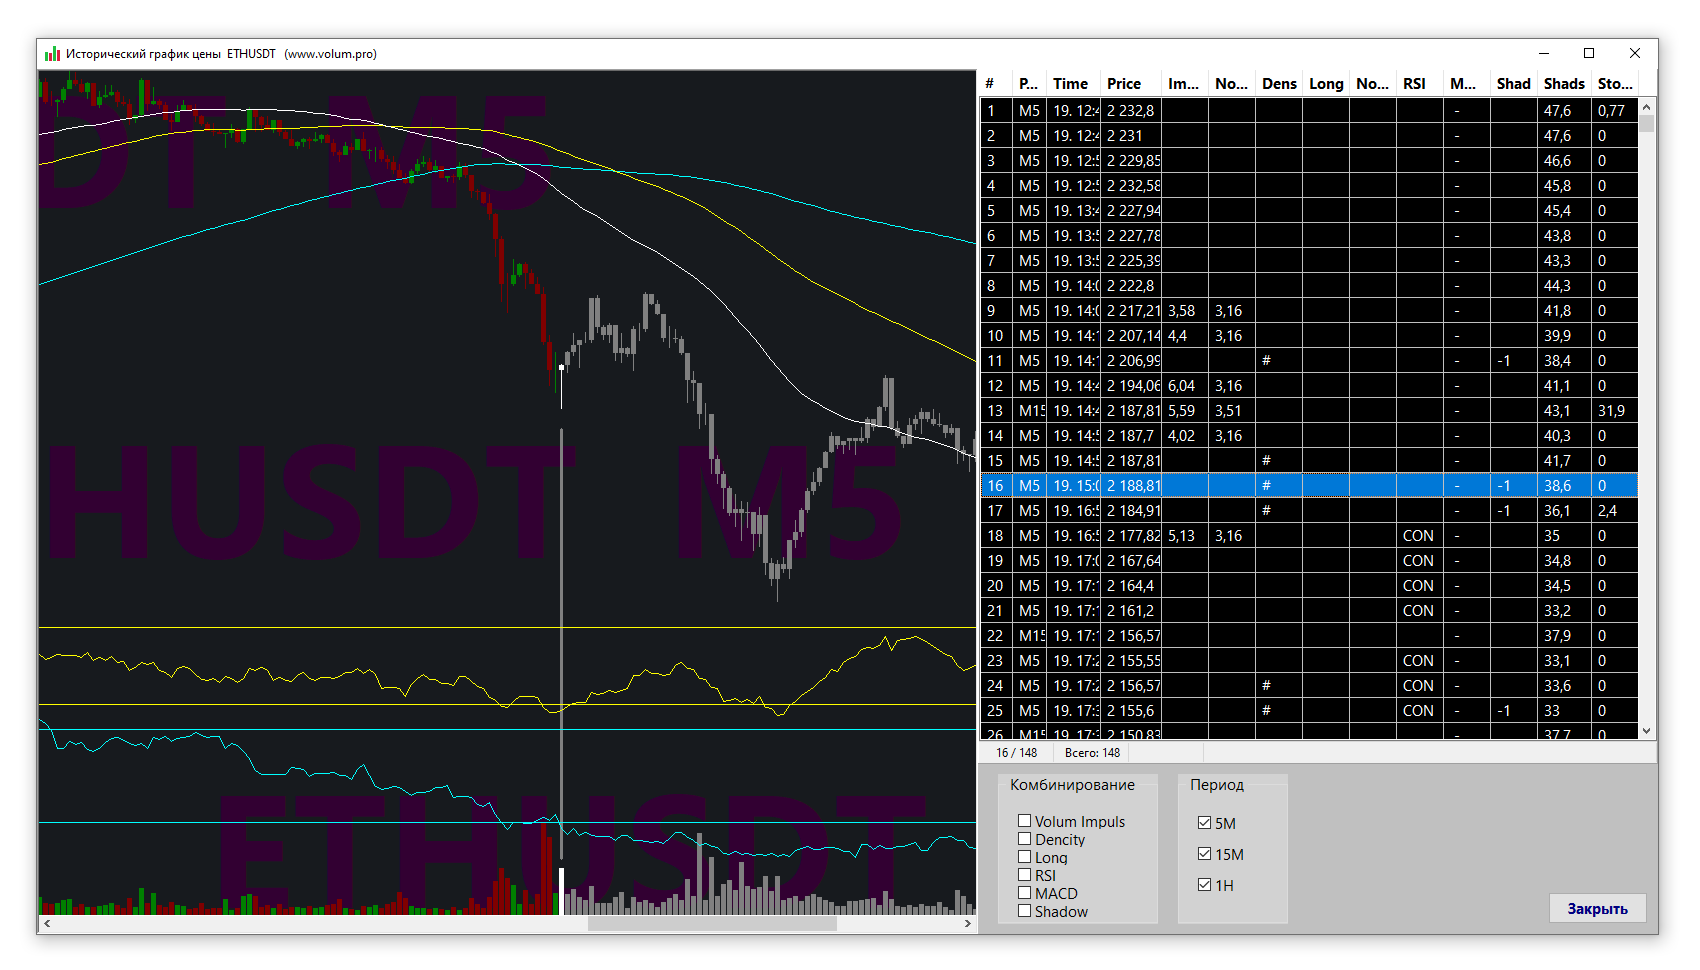
On the left side of the history window there is a graph of price changes; you don’t even need to explain anything here, everything is clear. Well, maybe the last candles are gray, these are the candles of the future. On the right is a table of all signals for all periods. At the bottom right there are two fields for turning on and off certain trading signals and periods. This helps filter signals. There is no signal from the "Stochastic” indicator in the list of filters, since it occurs too often on the historical chart, which means it will only clog up the overall picture with its presence. In addition, this "Stochastic” signal is almost always present in the company of other signals. There is also no filter for the signal from a group of candles [Shads]. Because this signal in itself means nothing. It is a confirmatory signal for other signals. But on the chart there is an oscillator [Shads] of this signal. Looking at all these signals on historical charts, we can draw the following conclusion. All these signals, in any combination, definitely do not show a large price reversal. They definitely show, in most cases, a price stop or a small rollback. This is exactly why all these signals can be used primarily for short-term trading. If you are using long-term or medium-term trading, then these signals can be used to partially close a profitable position or partially increase the volume of a position. If you stubbornly hold your positions against the global market movement, then no trading signals will help protect your capital. In the example shown in the picture, there is quite a good buy signal. Long shadow, Density of the candle body, The group of lower shadows is larger than the group of upper shadows (the [Shads] indicator is below the lower border), which means that cryptocurrency is being bought back at the bottom all the time. In addition, a little earlier, good volume impulses appeared on the candles at the price extreme. But the market still continues to go down. This means that the number of buy signals is still insufficient. But in the next place on the chart, where the price begins to slow down its movement, these buy signals are summed up with new buy signals and the probability of a price reversal upward will increase. I’ll write a few words about the local indicator [Shads]. The meaning of this indicator is simple. On the last fifty candles, the sizes of the lower shadows are significantly larger than the sizes of the upper shadows. This means that market participants from below are buying more aggressively than they are selling from above. And so, to make a trading decision, the number of signals must be sufficient. The more signals, the more likely the expected price movement.
Beginning of work
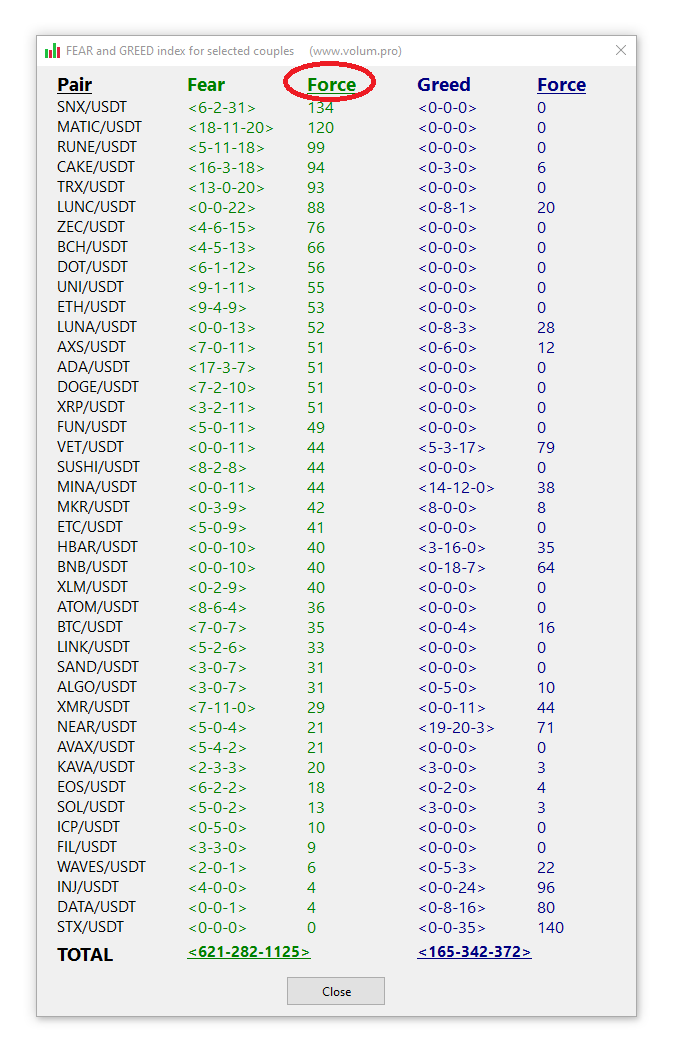
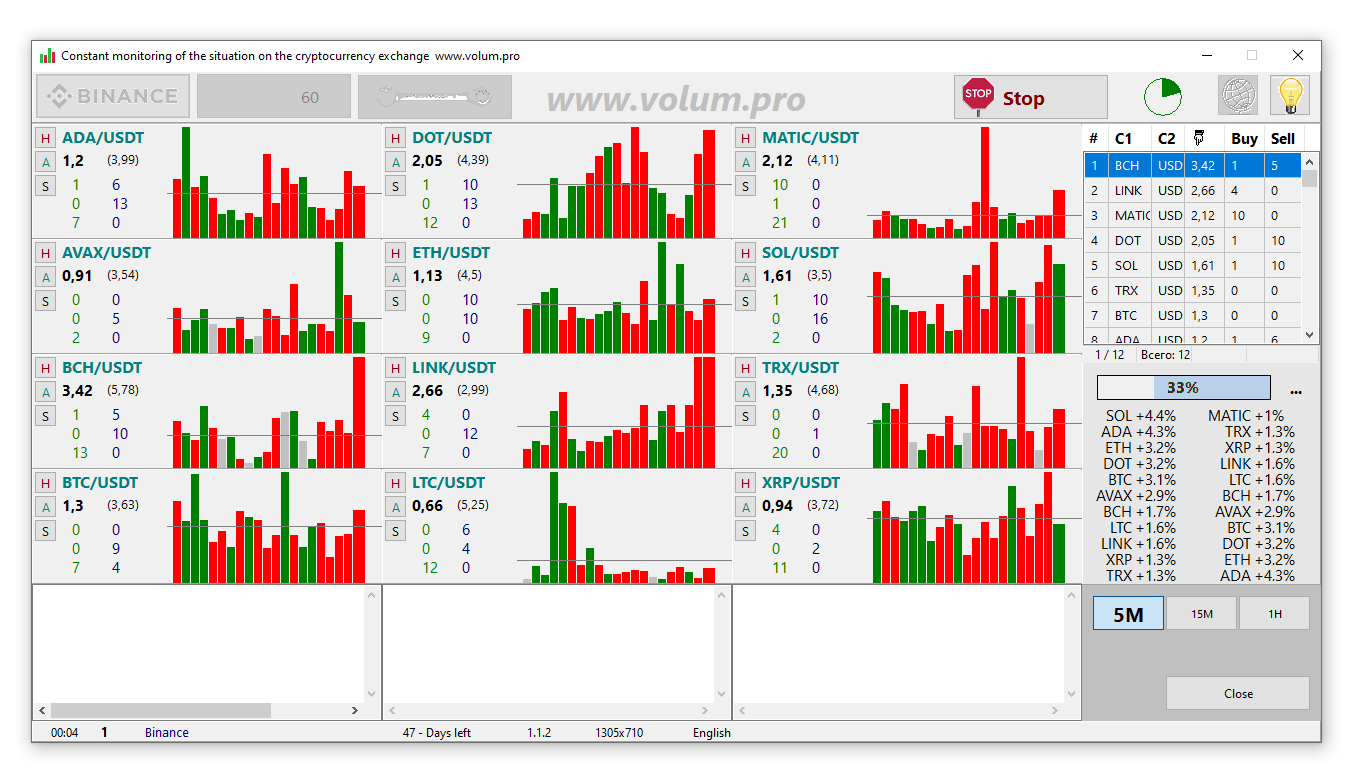
The calculation is based on the sum of all cryptocurrency pairs under consideration. Here you can sort entries by Pair and by Strength. In the picture below, all traded pairs are sorted by the strength of fear. Let's look at the first pair. The five-minute chart reports that there are four reasons to buy. The fifteen minute chart reports that there are fourteen reasons to buy. The one-hour chart tells you that there are eighteen reasons to buy. The older the chart period, the more significant its recommendations. The weight of recommendations on a fifteen-minute chart is twice as strong as the weight of recommendations on a five-minute chart. The weight of the recommendations of a chart with a period of one hour is twice as strong as the weight of the recommendations of a fifteen-minute chart. We multiply and then add all the numbers. We get the total strength of recommendations to buy the first cryptocurrency pair equal to one hundred and four. And this is how the calculation is carried out for each cryptocurrency pair. The result will be the total strength of fear for all cryptocurrency pairs under study. Exactly the same calculation is made for the power of greed. The relationship between the final strength of fear and the strength of greed will be the value of our indicator. The greater the number of total buy recommendations and the smaller the number of total sell recommendations, the stronger the strength of fear. And this is the best time for purchases and vice versa for sales.
Check arbitration.
And so, Arbitration. If you are reading these lines, then you know what arbitration is. Arbitration situations can be used in three cases. Case one, buy a coin on an exchange where it is cheaper, transfer it to an exchange where it is more expensive and sell it there, then transfer the profit back to the first exchange. The pros and cons of this situation are simple and clear. The second case is this: on two exchanges you have the necessary coins and a good arbitrage situation has formed for them. You buy on the first exchange and immediately sell on the second exchange, without transferring anything anywhere. Clear savings on translations, minus the risk of price changes. You are trading on only one exchange and this is the third case of using an arbitrage situation. A situation has arisen when the price of some coin on your exchange has become significantly lower than the price of it on all other exchanges. The likelihood that prices on all other exchanges will drop to the price on your exchange is much less than the likelihood that the price on your exchange will begin to catch up with prices on other exchanges. Then you simply buy that lagging coin. The arbitration situations provided by the VolumPro program are for informational purposes only. Arbitration can only be carried out with those coins that are currently working. The VolumPro program currently has access to 60 exchanges. Some countries block some exchanges, so it is not guaranteed that all of these exchanges will be available to you. When running the VolumPro program, exchanges are scanned for all tradable cryptocurrency instruments.
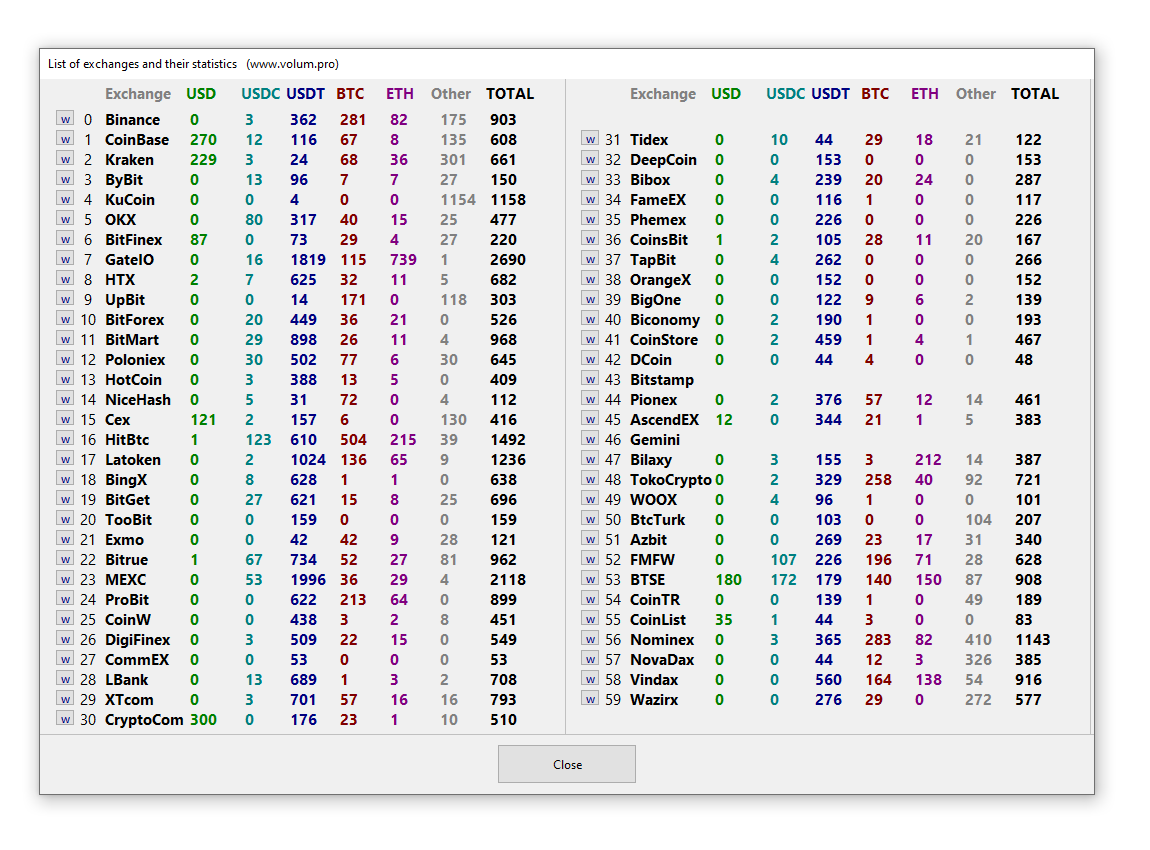
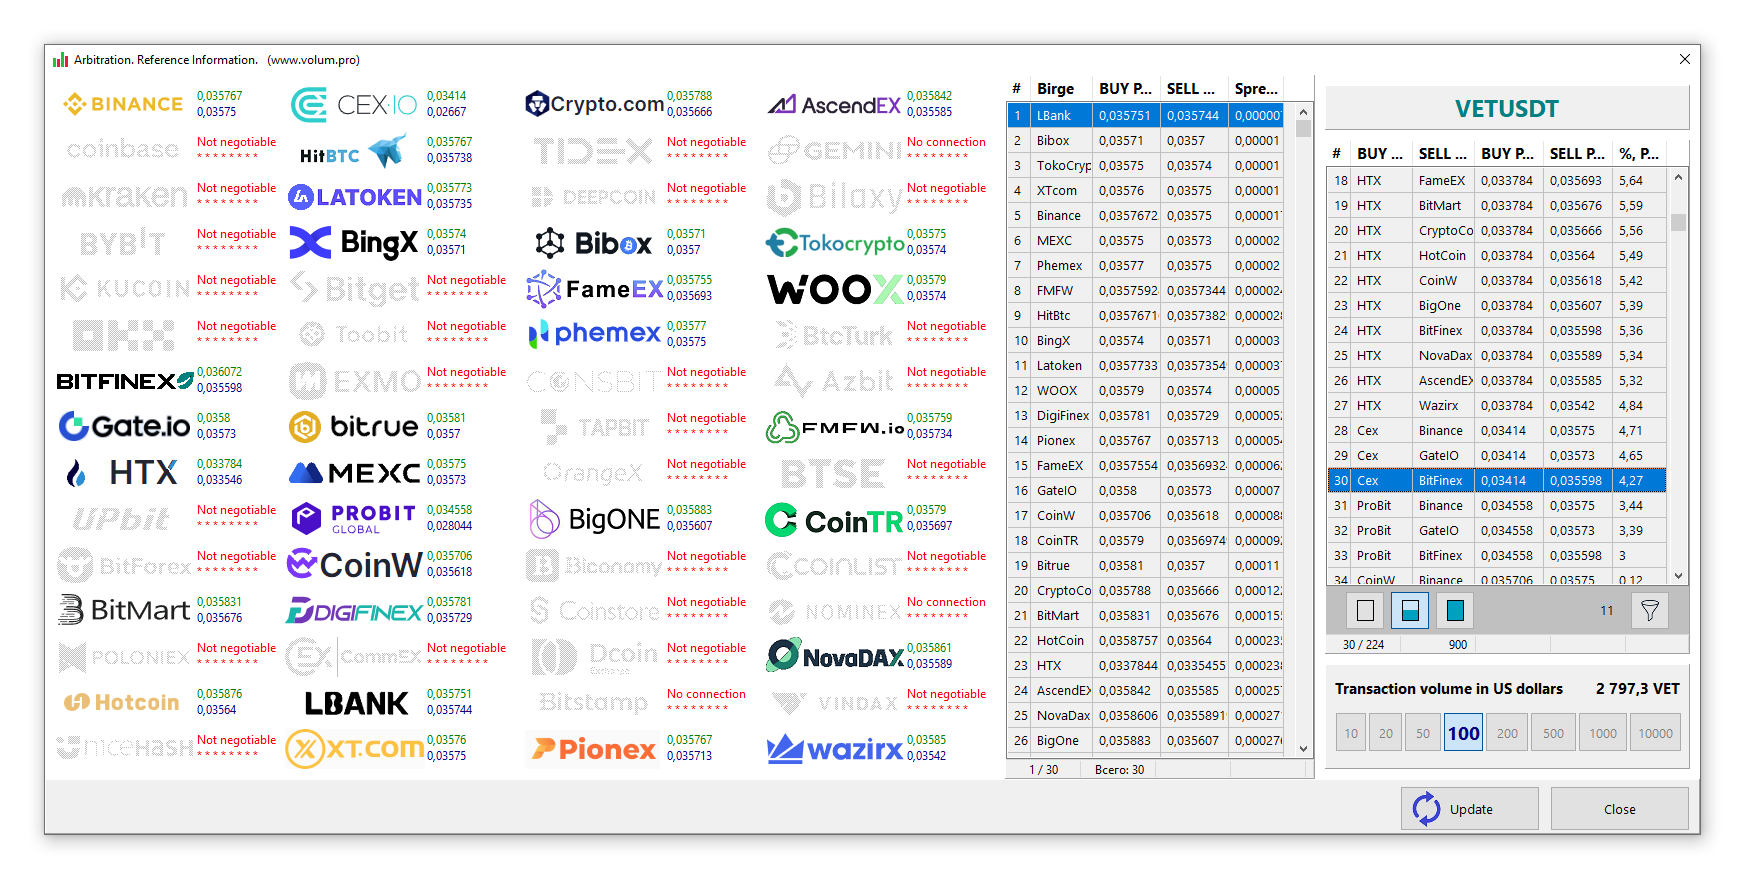
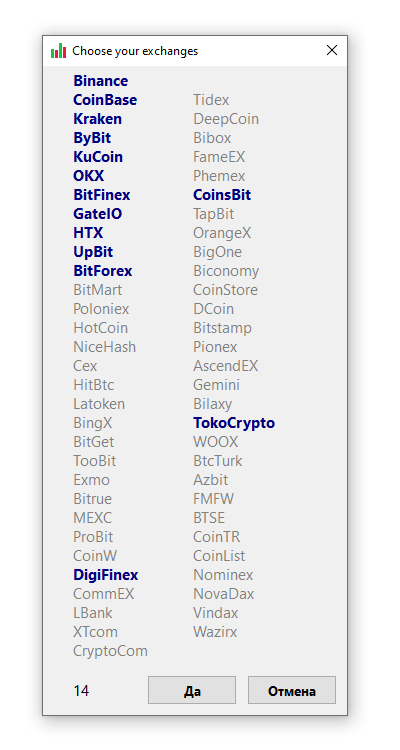
During the main work of the program, you can simultaneously look at the arbitration situations of working couples. To do this, each cryptocurrency pair has a [A] button. The Arbitration window is simple and clear. On the left are the exchanges that are participating in arbitration or not due to lack of contact with the exchange or the absence of the trading pair in question on the exchange. Double-clicking on the logo of any exchange will open a window with a list of traded pairs. Next to the exchange logo, the current purchase and sale price of the selected volume is displayed. Or information is displayed about the reason for not receiving the current price. In the center of the window there is a table with a list of exchanges participating in arbitration and the actual spread for the selected trading volume. The list is sorted by spread size. On the right is a table with a list of all possible arbitrage combinations between these exchanges. The list is sorted by arbitrage profitability. The list is very large, so it can be filtered by exchanges of interest. The button with the image of a filter opens a window with a list of all exchanges. In it you can select several of your favorite exchanges and then partially or completely filter this huge list. Below this table there is a field with the ability to select the volume of the proposed arbitration. The volume is selected in USDT equivalent. The final price of the transaction depends on the volume of the transaction, so this is a very important condition for understanding the entire process. If you arbitrate not very liquid cryptocurrency pairs with a large volume, you can get a loss instead of the expected profit. When choosing between volumes, you can immediately see what the approximate volume of the quoted coin will be. Also, the readings in the tables will change, which naturally depend on the volume of arbitration. Double-clicking on the table of arbitrage combinations will open a window with current arbitration details.
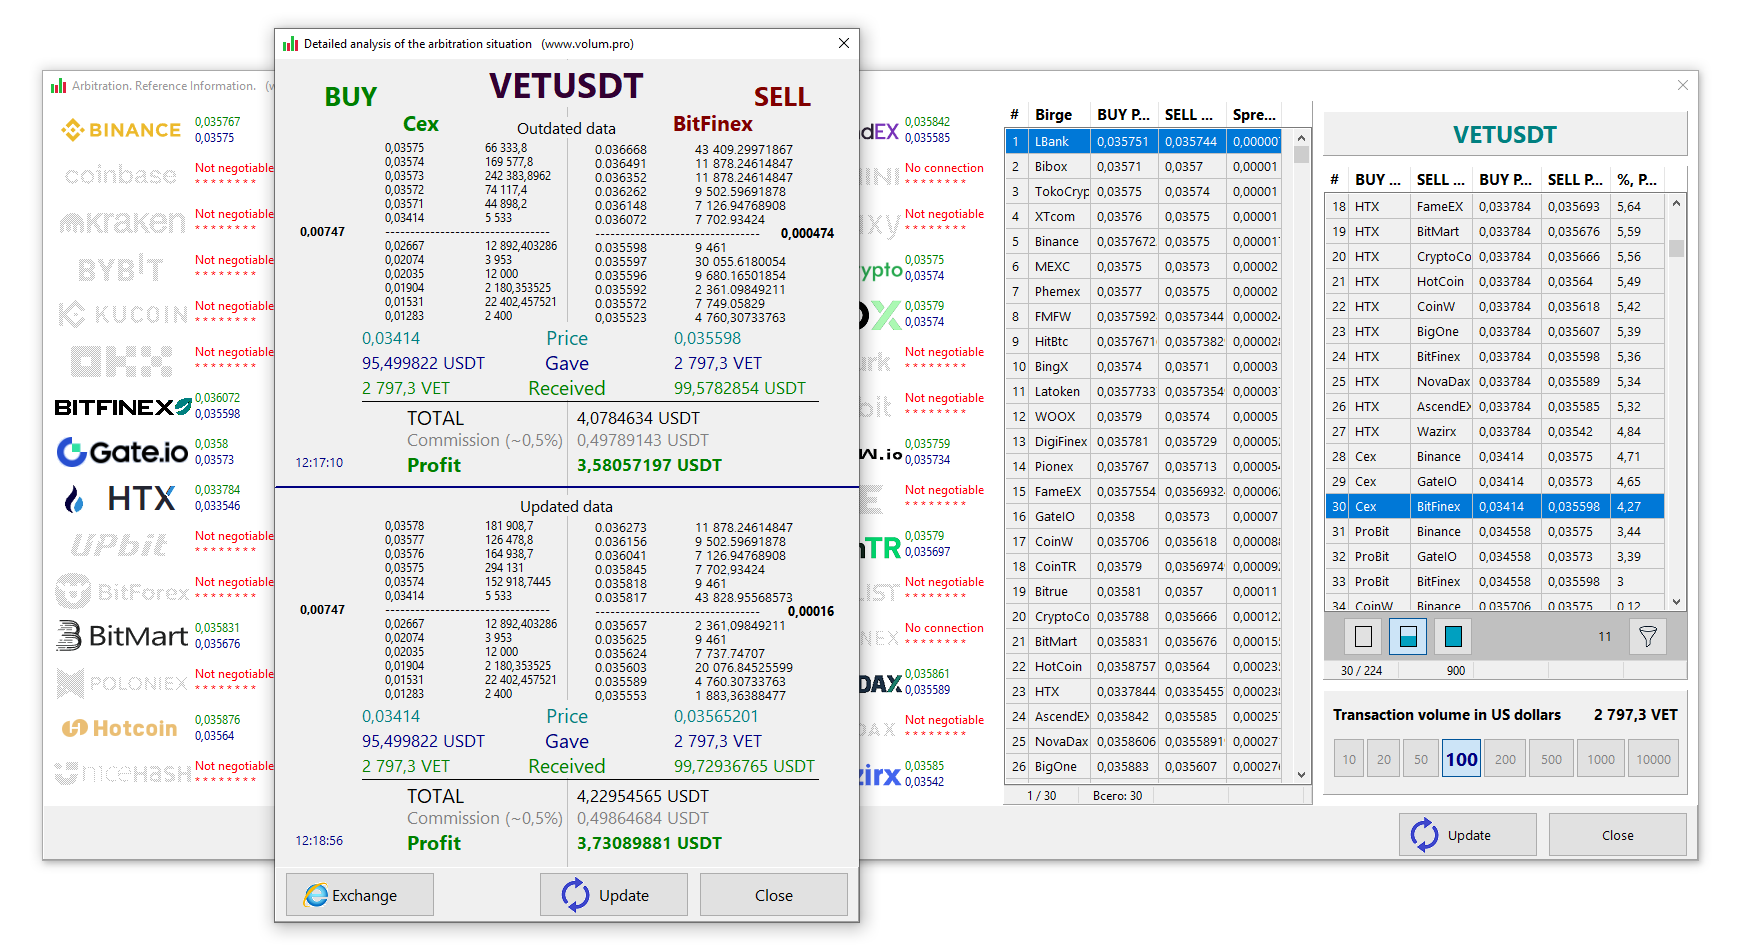
These details will be as close to reality as possible. It is possible from this window to immediately go to the trading floors of two exchanges and look at the current real prices. For this purpose, there is a "Exchange” button in the lower left corner of the window. In this new window, on the left side there is all information on the terms of the Purchase, on the right there is all information on the terms of sale. The top of the window contains outdated information, and the bottom of the window contains updated information. The time at which out-of-date and updated information was received is displayed on the left side of the window. There is also information on the state of the Depth of Market (Price, Volume and Spread). Just below the Depth of Market is the estimated Buy and Sell price. Next is the volume of the coin given away. The volume of coins received is even lower. We draw a line under all this and calculate how much profit we get in the end. In the calculations, we take into account the approximate size of the commission from the two exchanges (to be safe, this amount is slightly overestimated and equals half a percent). We look at the result of all these calculations and think about how good or bad arbitrage is on these exchanges. Naturally, the arbitration situation changes all the time. Therefore, using the "Update” button every ten seconds you can monitor this update. Of course, this entire process ideally fits the second and third conditions for the use of arbitration and in no case fits the first condition. Since for the first condition the following unexpected points must also be taken into account. Is it possible to deposit or withdraw the required coin on the exchange at the moment? What are the fees for withdrawing a coin? What are the transaction times for the required coins? And all this is a very significant loss of both time and money. Be careful with this.