"SimpleTest" - Trading Strategy Testing Program
The world`s simplest trading strategy
Trading according to this strategy does not require any knowledge of trading or technical analysis from the user. Indicators and oscillators are not needed, moreover, you do not even need a price chart. You just need to monitor your balance and nothing more. The idea of this strategy can be the foundation for building other various trading strategies on its basis. Of course, you need to trade according to this strategy on the spot market or on exchanges where there are no swaps. Yes, such exchanges exist. So, the meaning of this strategy is very simple. We buy an asset, for example, for 1000 USDT and once a day, at the same time, we look at the balance of this asset. If it has fallen by more than 10 percent, for example, by 11 percent, then we buy the asset for 110 USDT, so that the asset amount again becomes equal to 1000 USDT. If the asset amount has grown, for example, by 12 percent, then we sell exactly as much so that the asset amount again becomes 1000 USDT. While the balance is in the corridor from -10 percent to 10 percent - we do nothing. Does such a simple approach to trading give any effect? The program "SimpleTest" will help to answer this question.
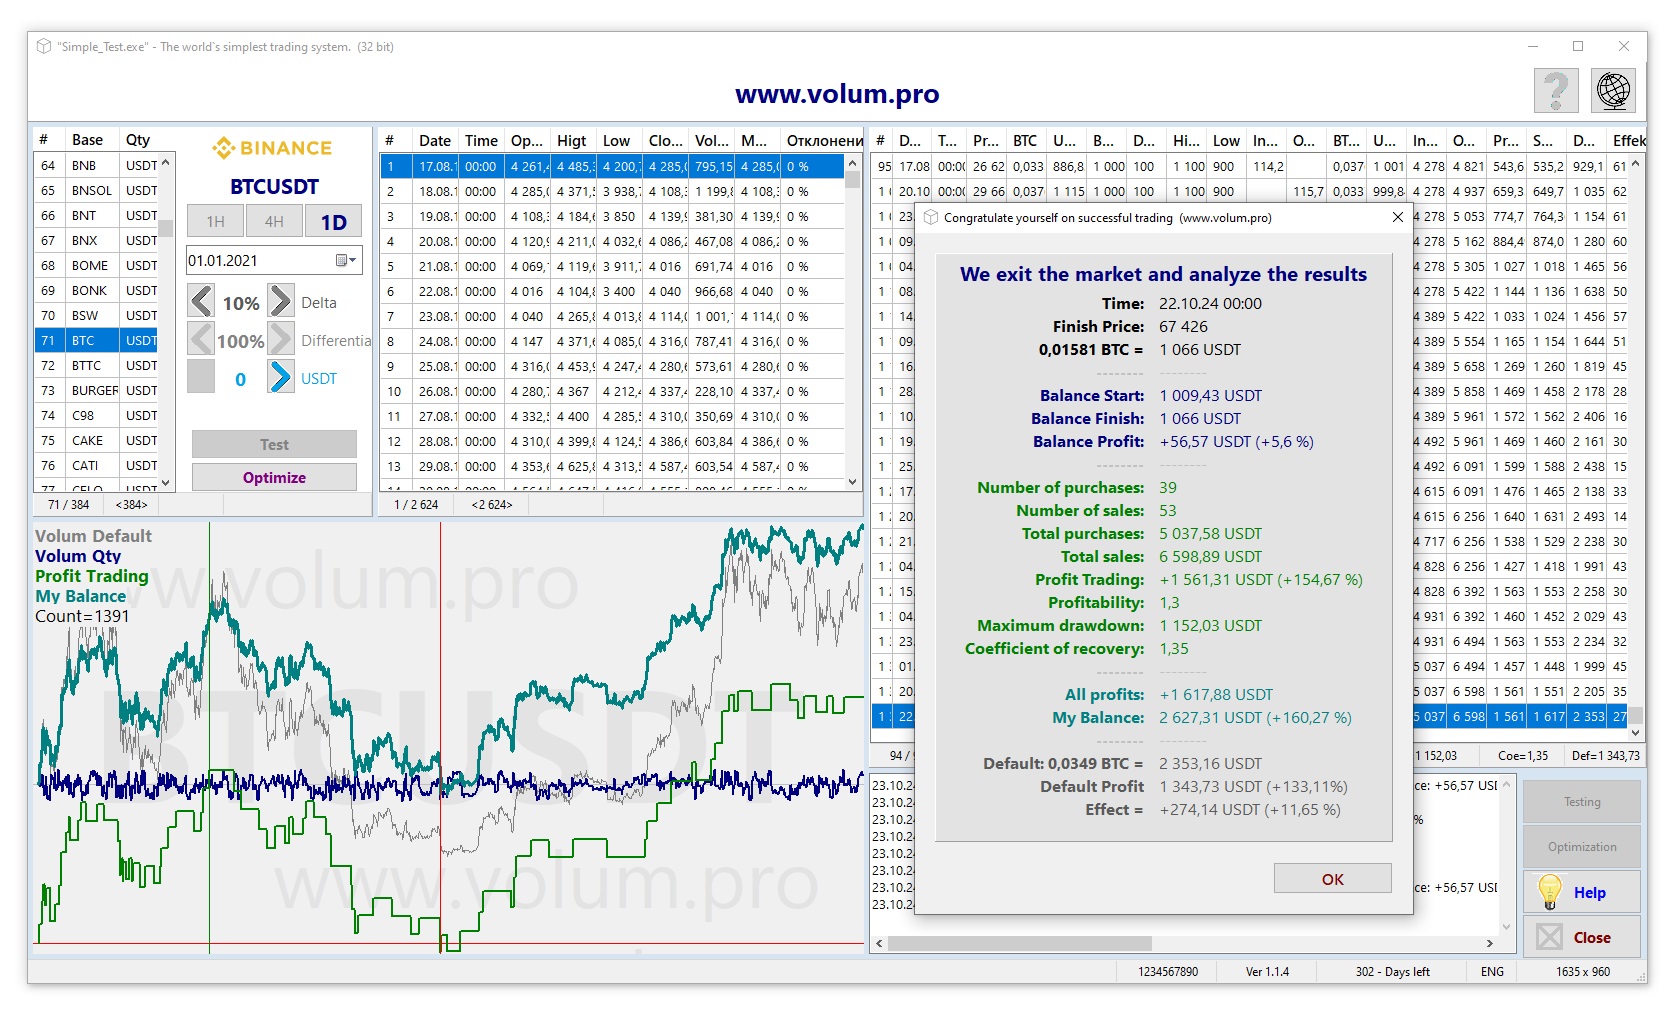
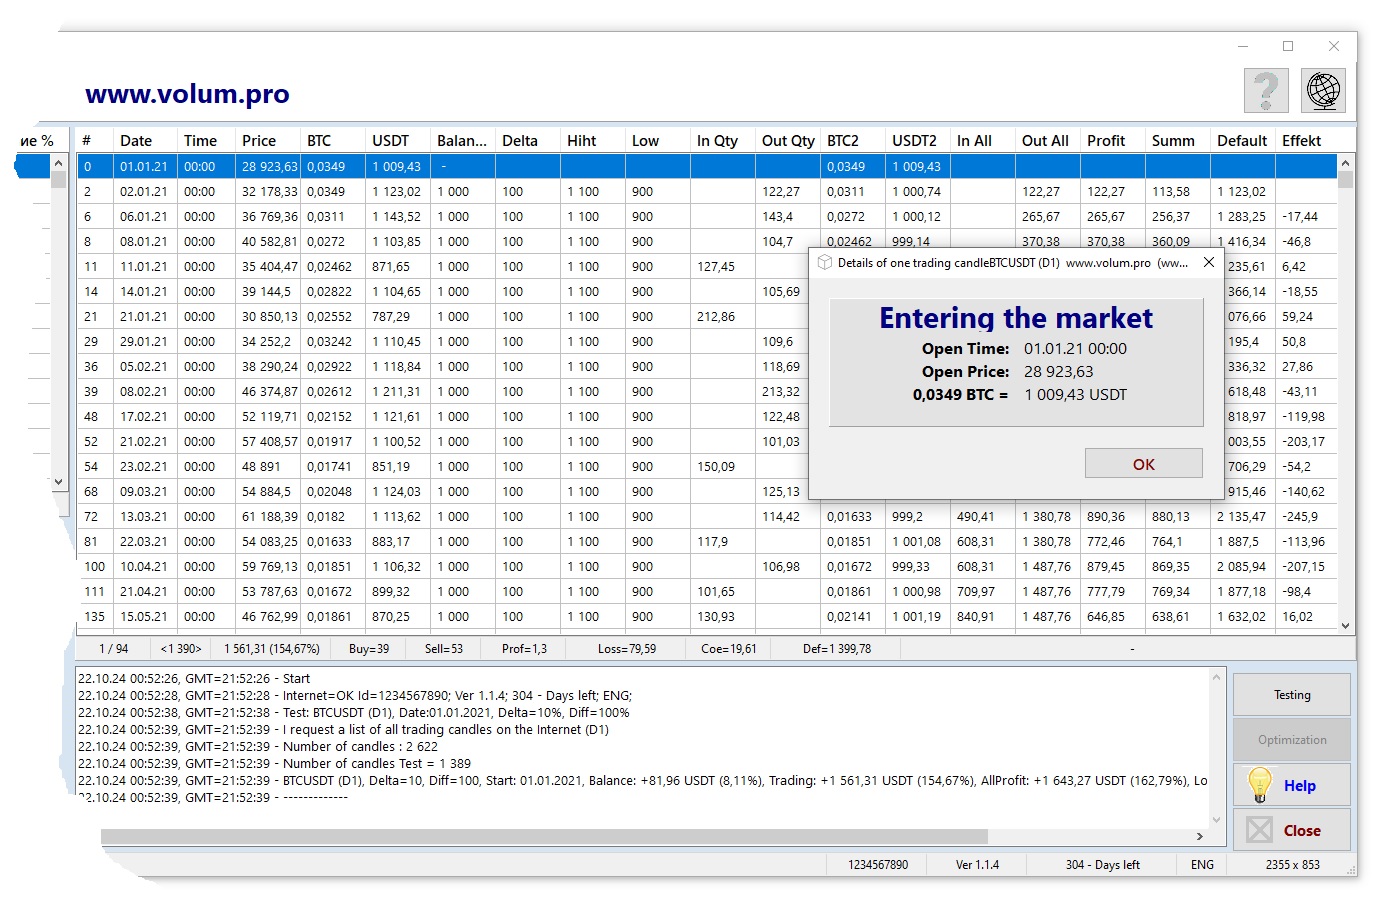
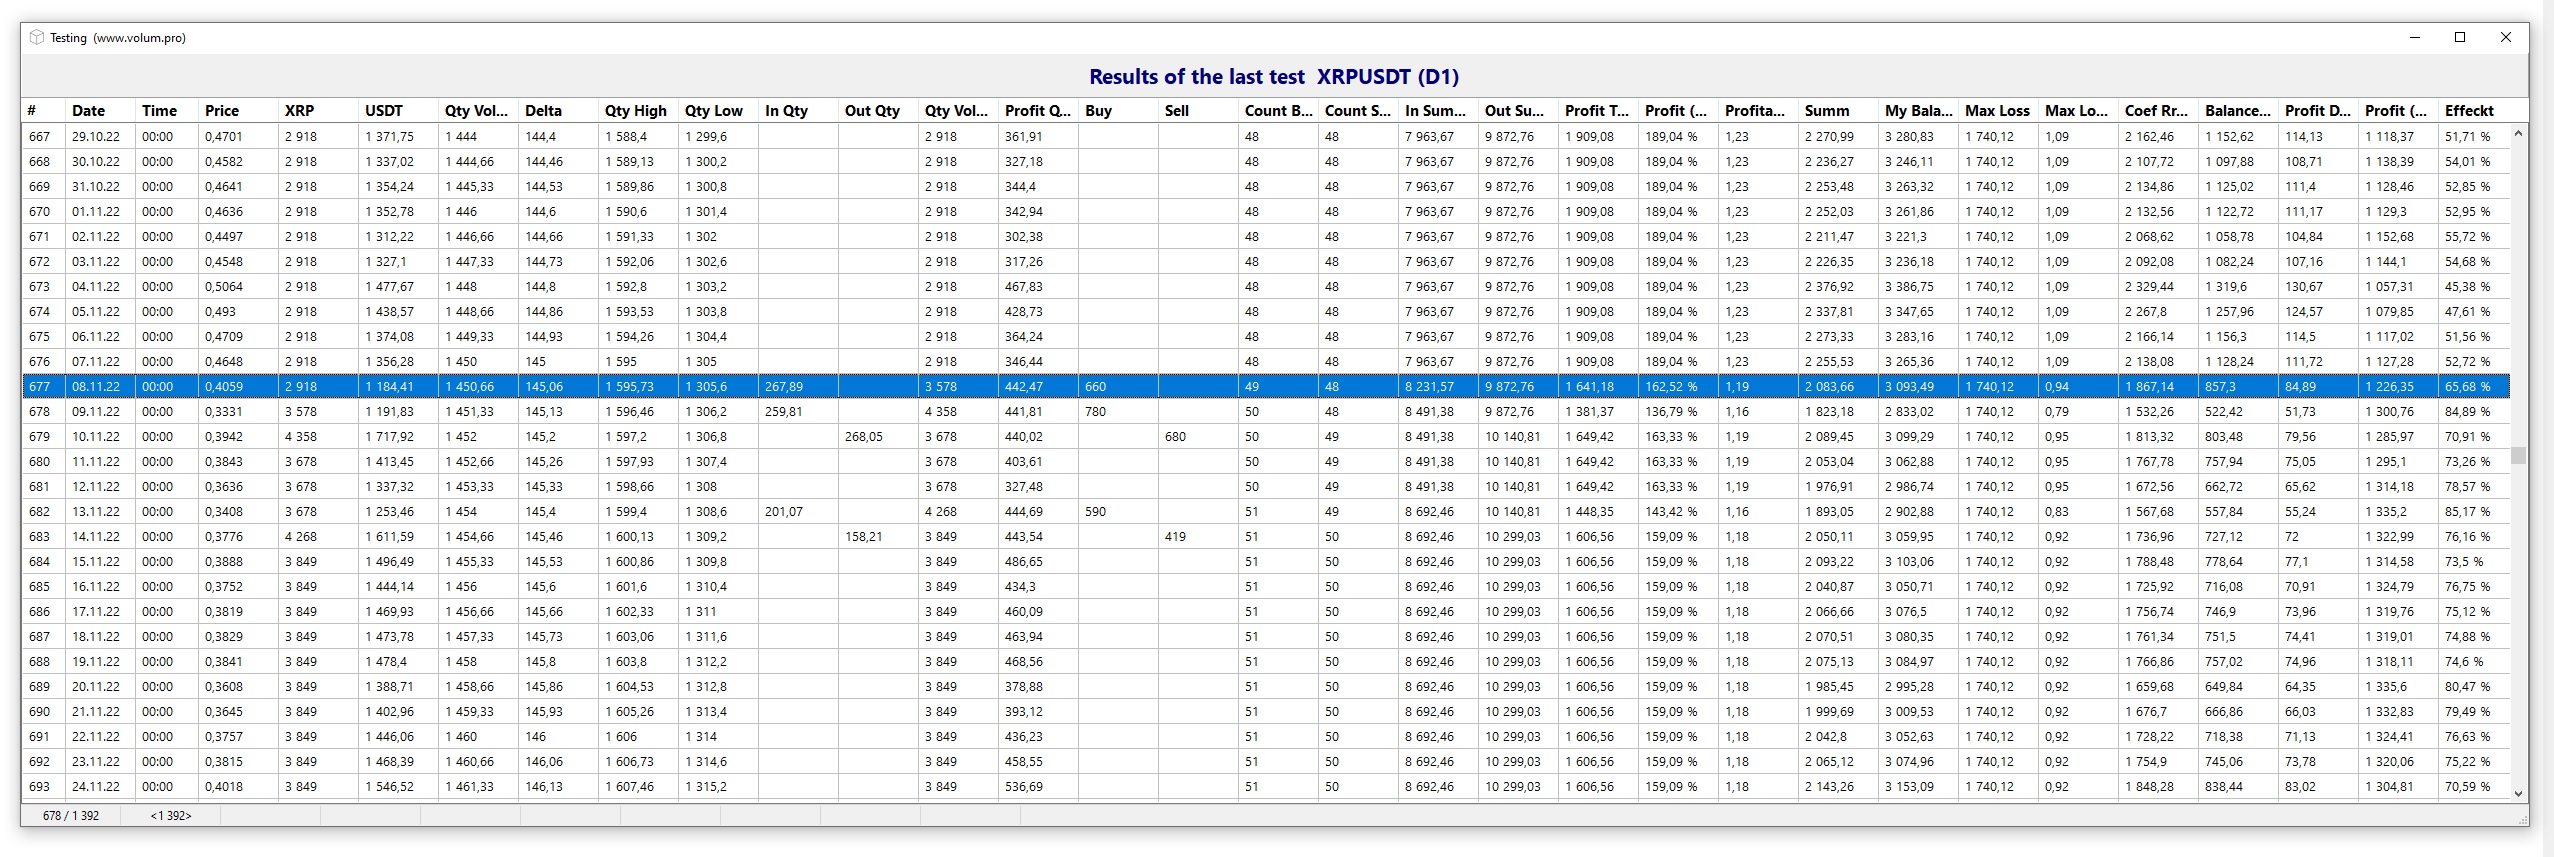
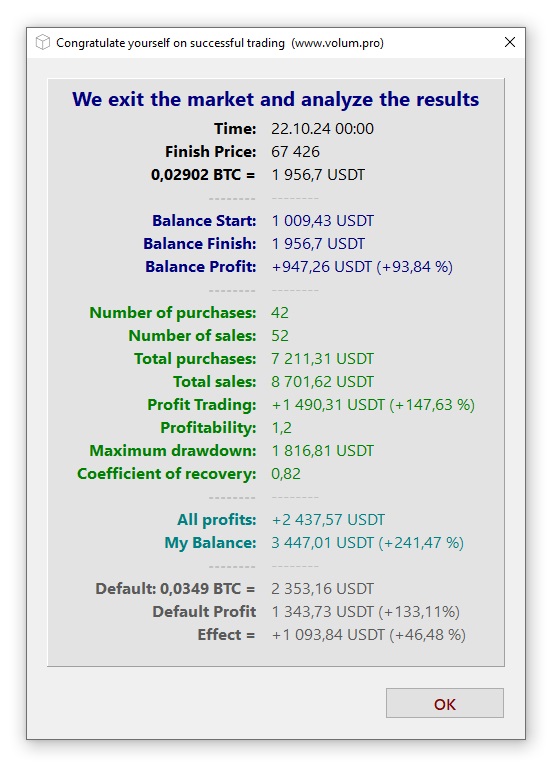
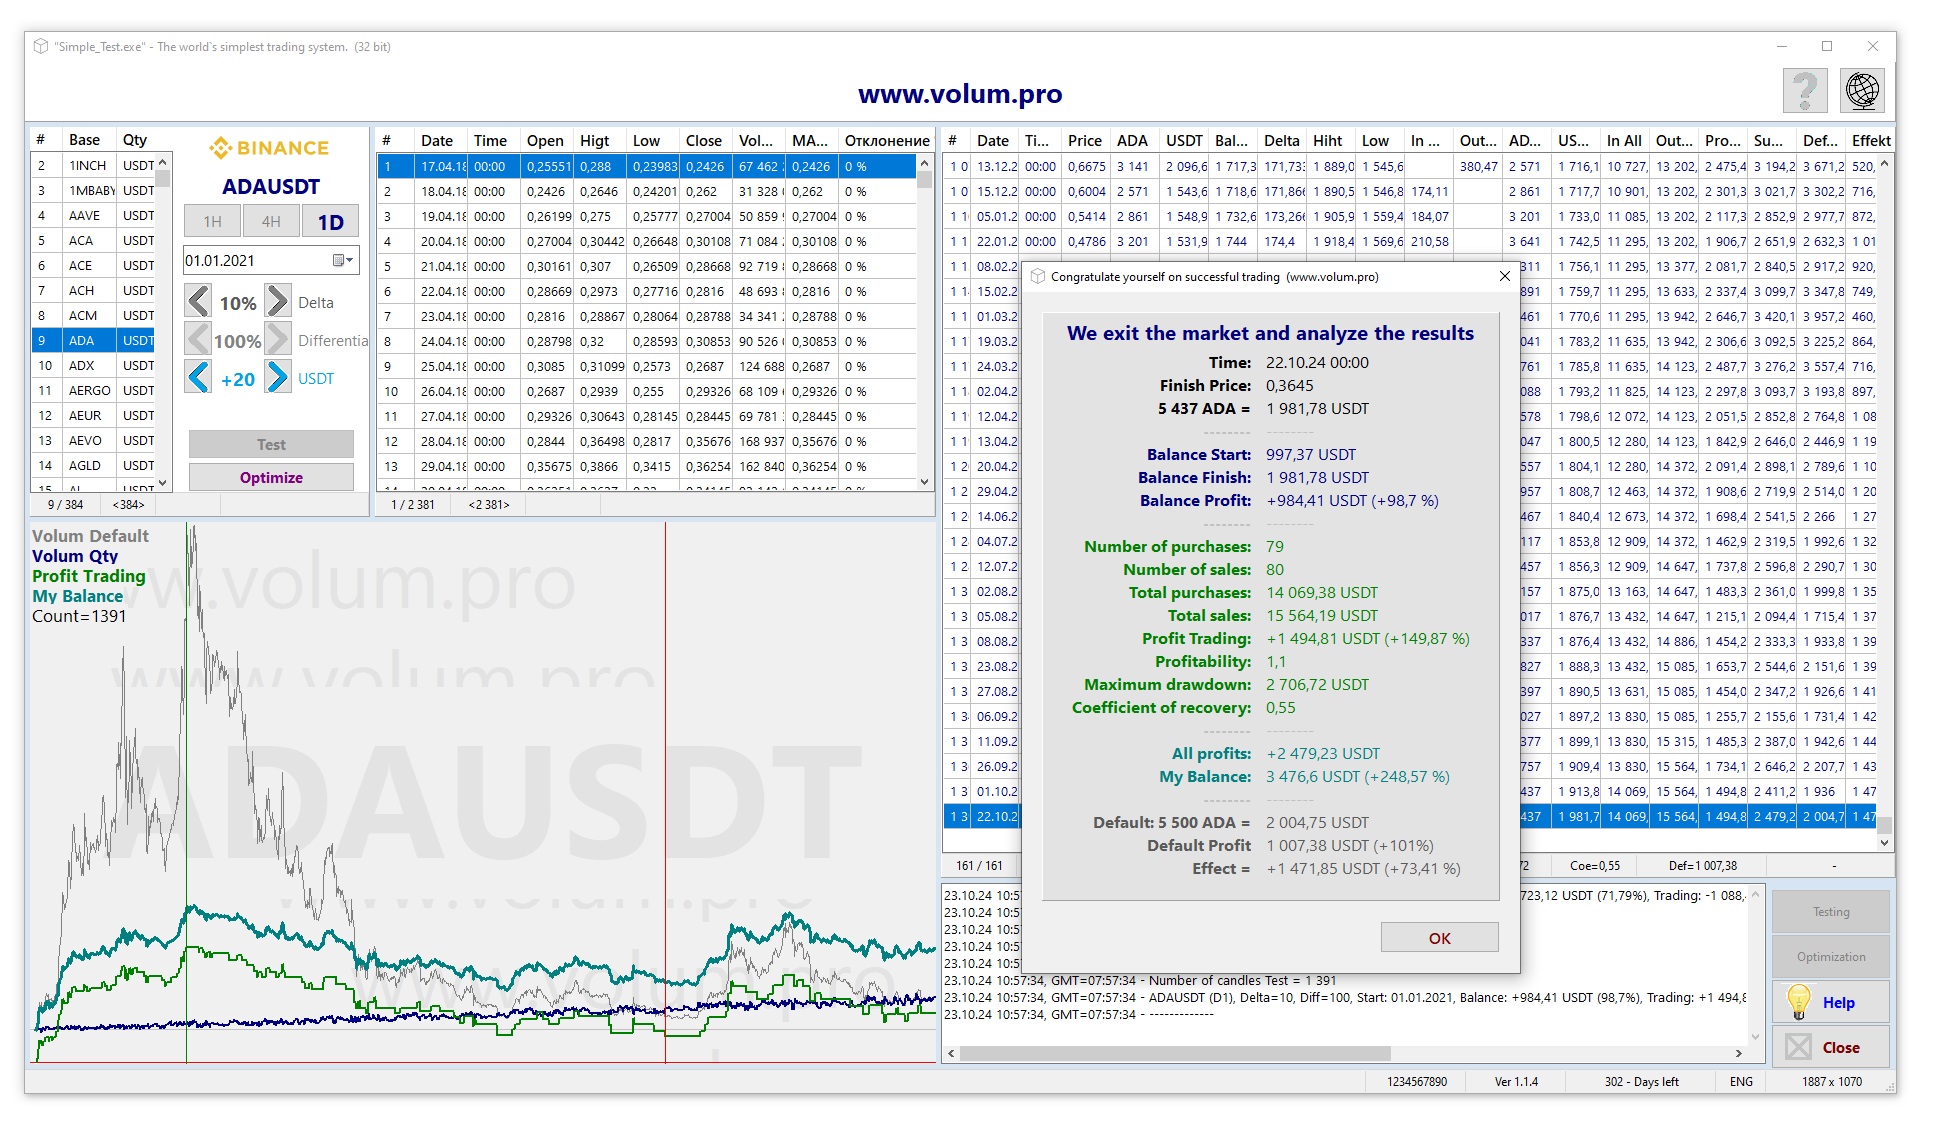
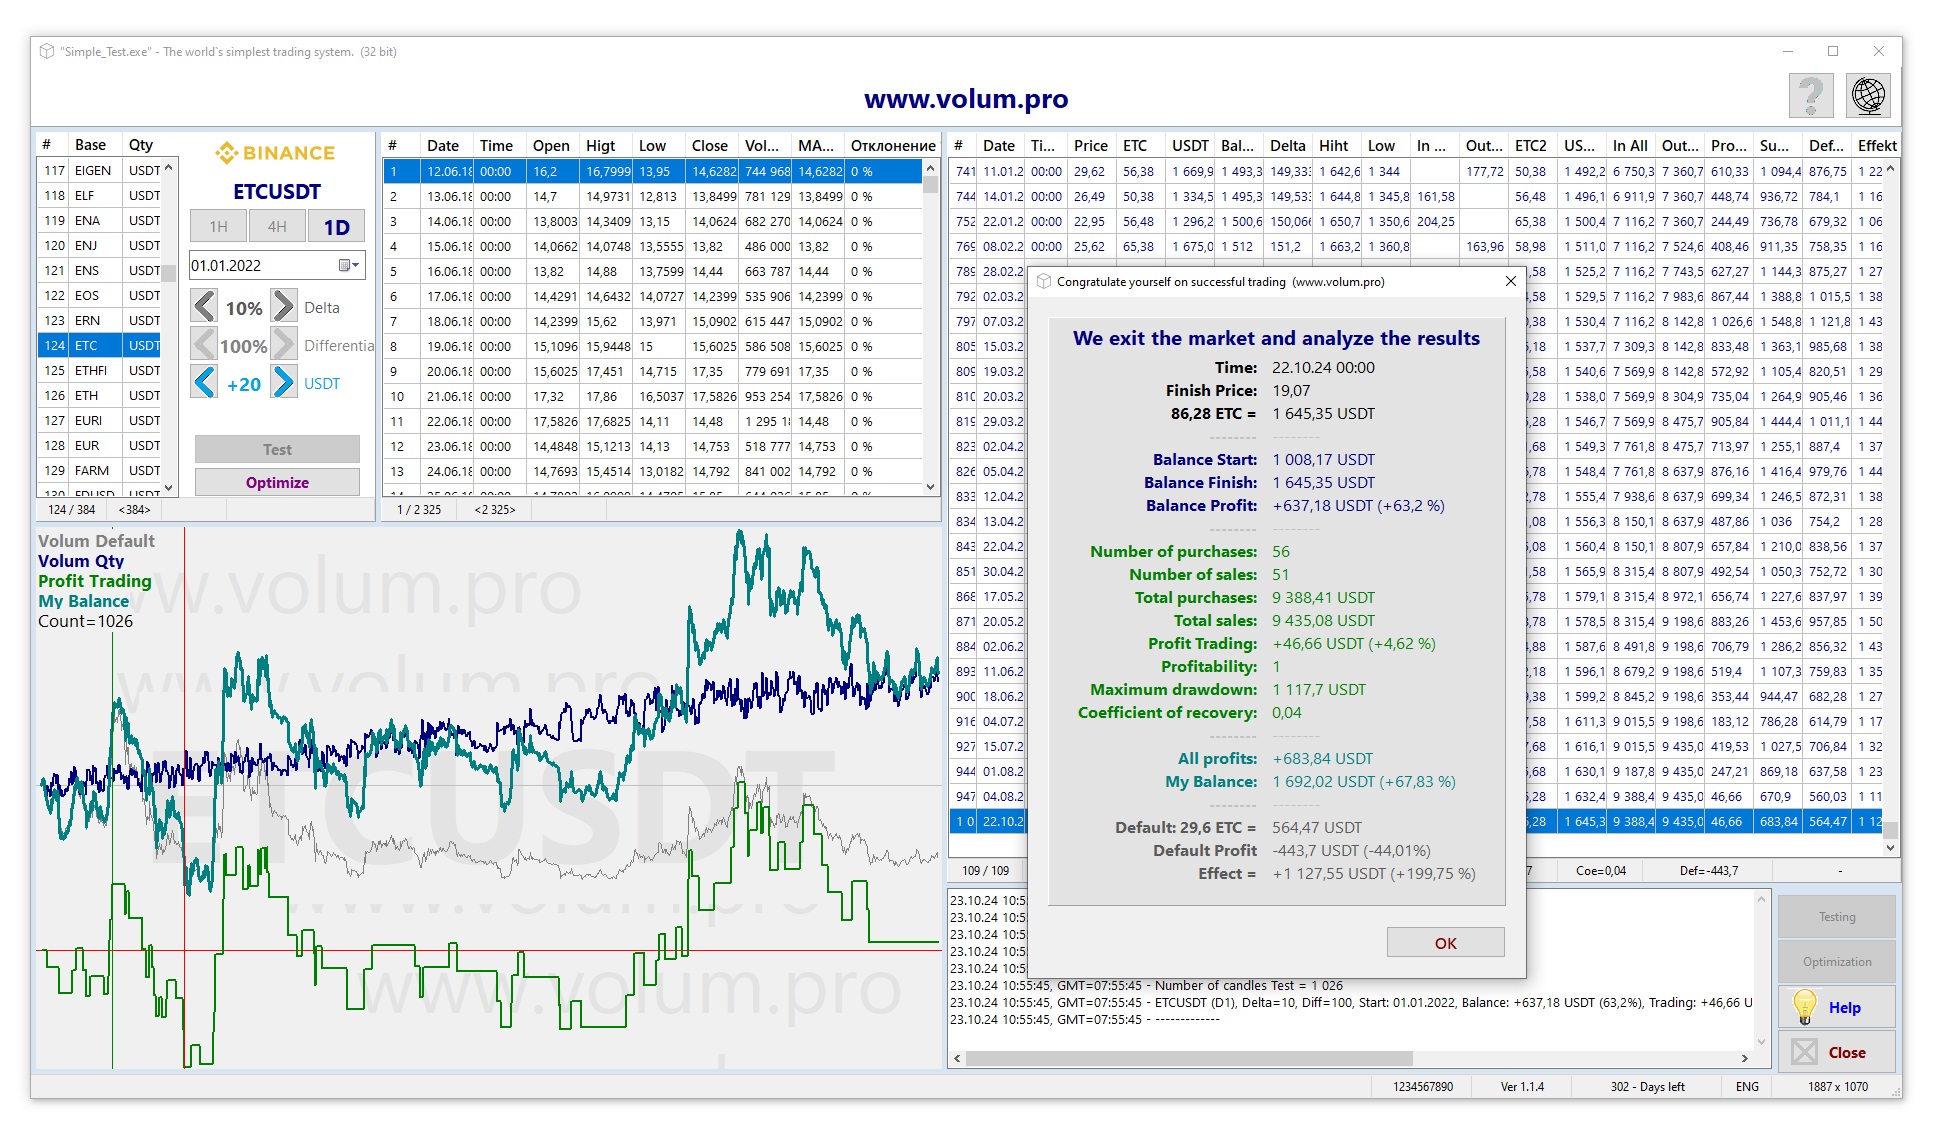
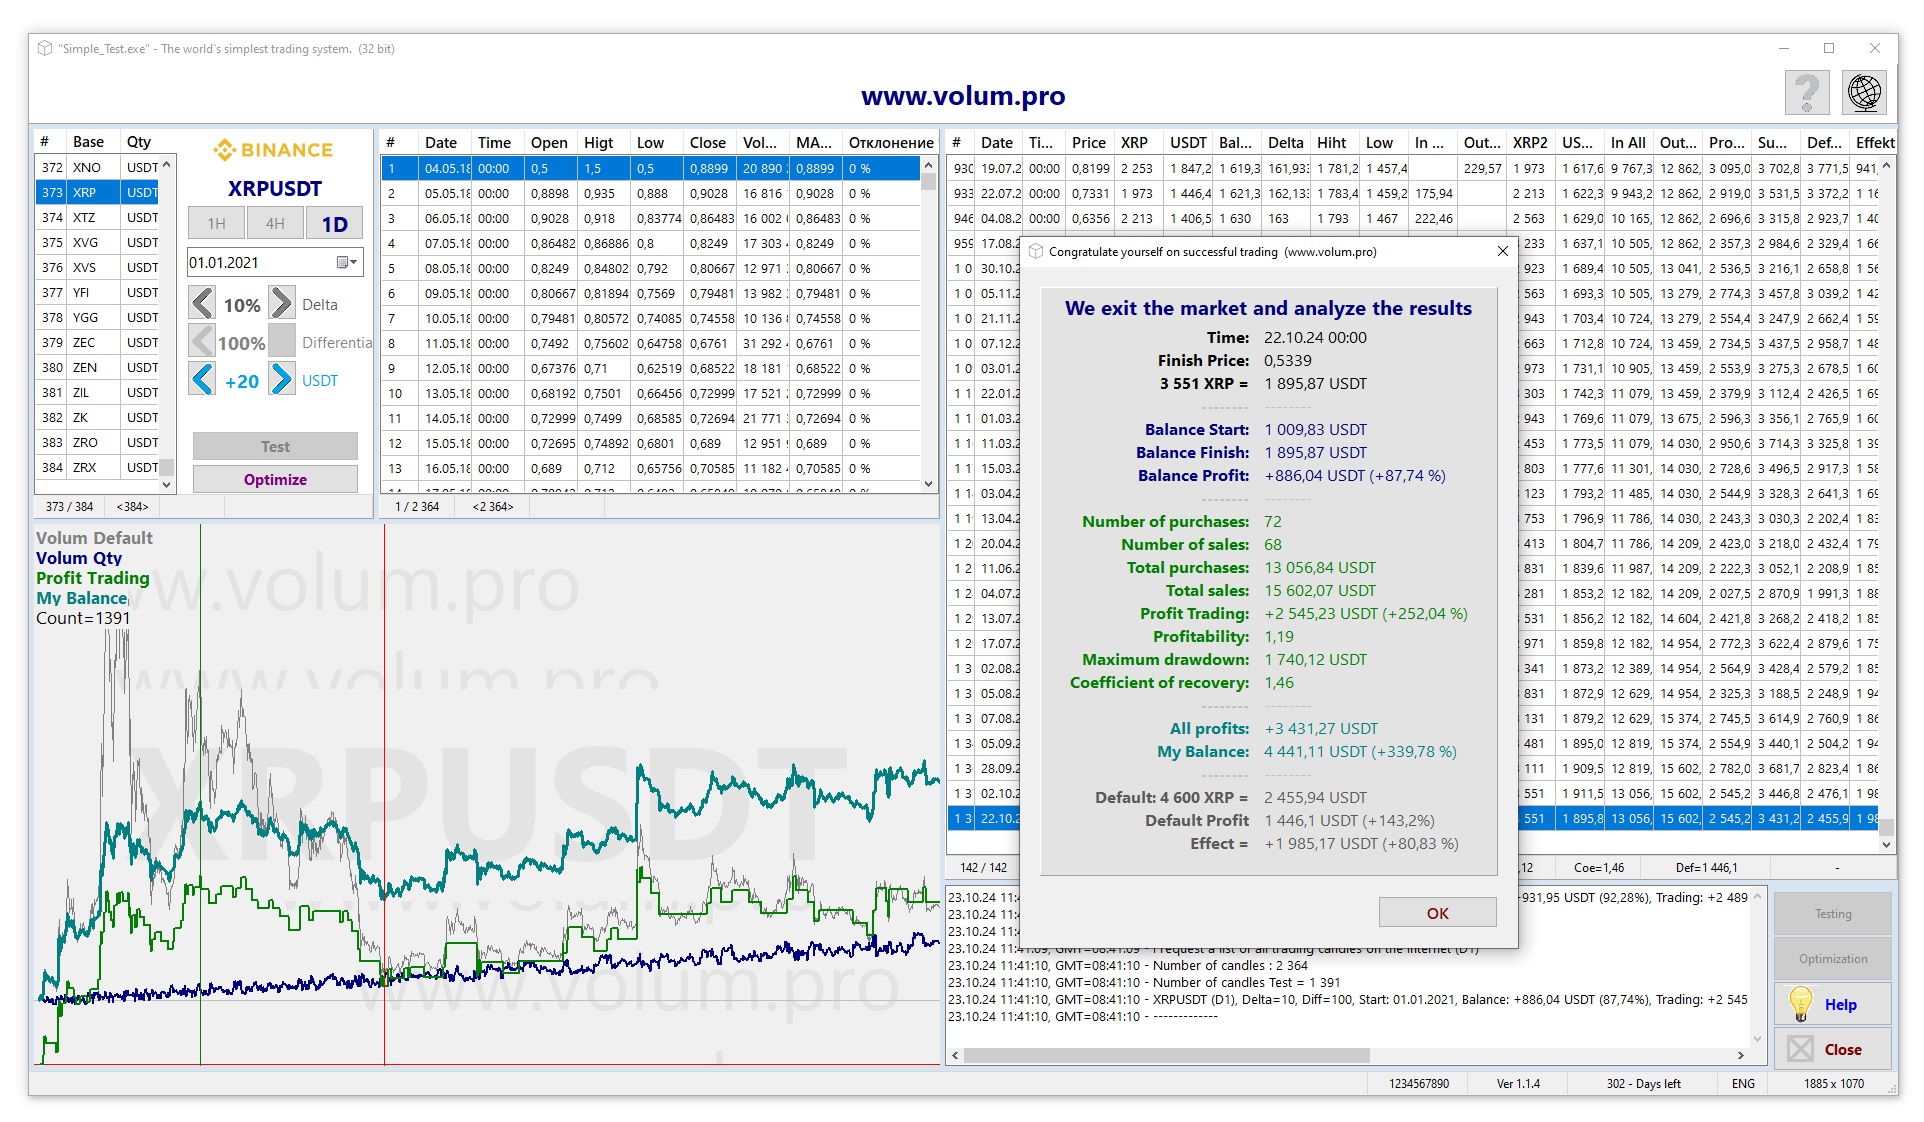
The first table, at the top left, provides a list of trading pairs to be tested. The list is sorted alphabetically. You can select a pair for testing by double-clicking on it or pressing the “ENTER” key. Then you can select one of three periods. It is better to select the “1D” (Day) period, it will be clearer and easier. You also need to determine the start date of testing. For example: 01-01-2021. Then manually select the “Delta” deviation from the base balance. The deviation is expressed as a percentage. The base balance, as we determined earlier, is an unchangeable value equal to 1000 USDT. There are a couple more values, but we will talk about them a little later. For now, we will simply accept their default values. Deff = 100 percent and 0 USDT. Now that we have decided on the initial conditions, we can start testing our strategy on history. After clicking the “Test” button, the program will access the database on your computer in the “Candles” section. The missing data will be requested from the Binance exchange and added to our database. The first time you test a trading pair of a certain period, the time to receive data will be a little longer than usual, but in subsequent cases everything will be much faster. All records of the candlestick database are displayed in the second table. And so, we test our strategy. At the start of our trade, the price of the Base currency (BTC) is 28923.63 USDT. At this price, we buy 0.0349 BTC for approximately 1000 USDT. We give 1009.43 USDT for this transaction. The window that opens shows the results of our trade.
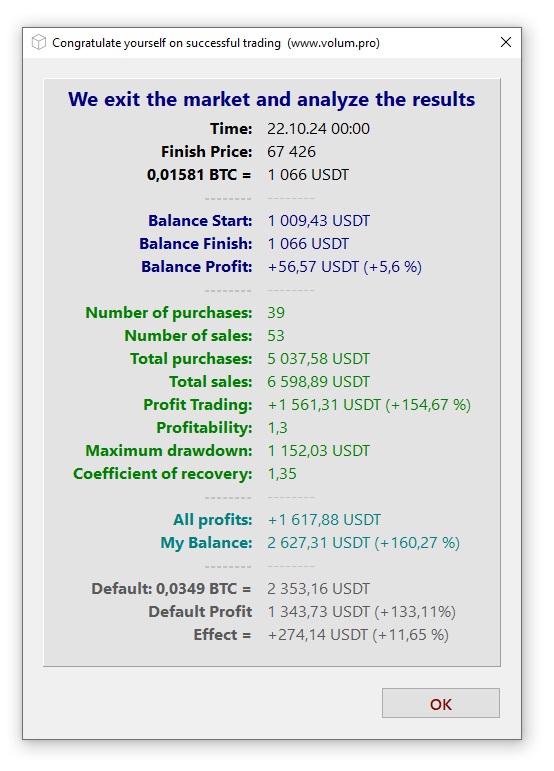
The first three lines display the moment of closing our trade: time, price, amount of base currency (BTC) and amount of quote currency (USDT). The next three lines show changes in the starting balance for the entire trading period. Then, several lines with the results of our active trading are displayed in green: the number of purchases and sales, the total volume of purchases and sales, trading profit, strategy profitability [sales volume divided by purchase volume], maximum drawdown and recovery ratio [Profit divided by drawdown]. Then, two lines of turquoise lines display the total profit of our trade: Total profit (Profit by balance trading profit) and the final balance. Well, the last three lines show us whether our trading was more efficient than the market and by how many percent more efficient than the market. For clarity, the trading results are also displayed graphically.
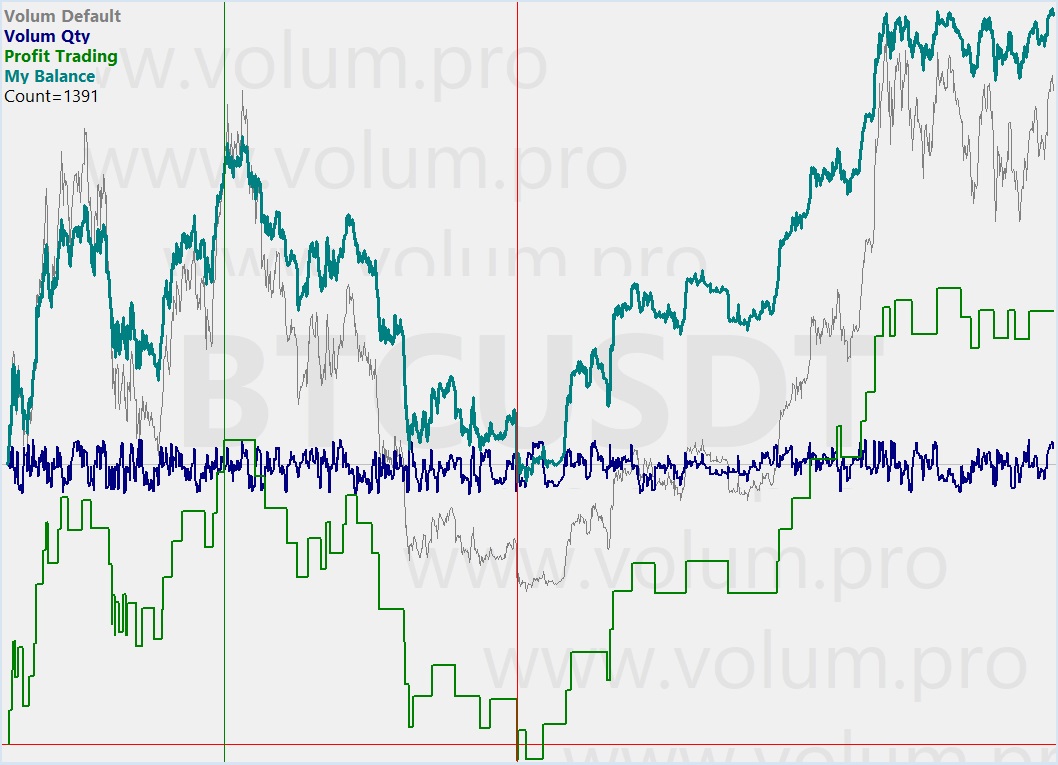
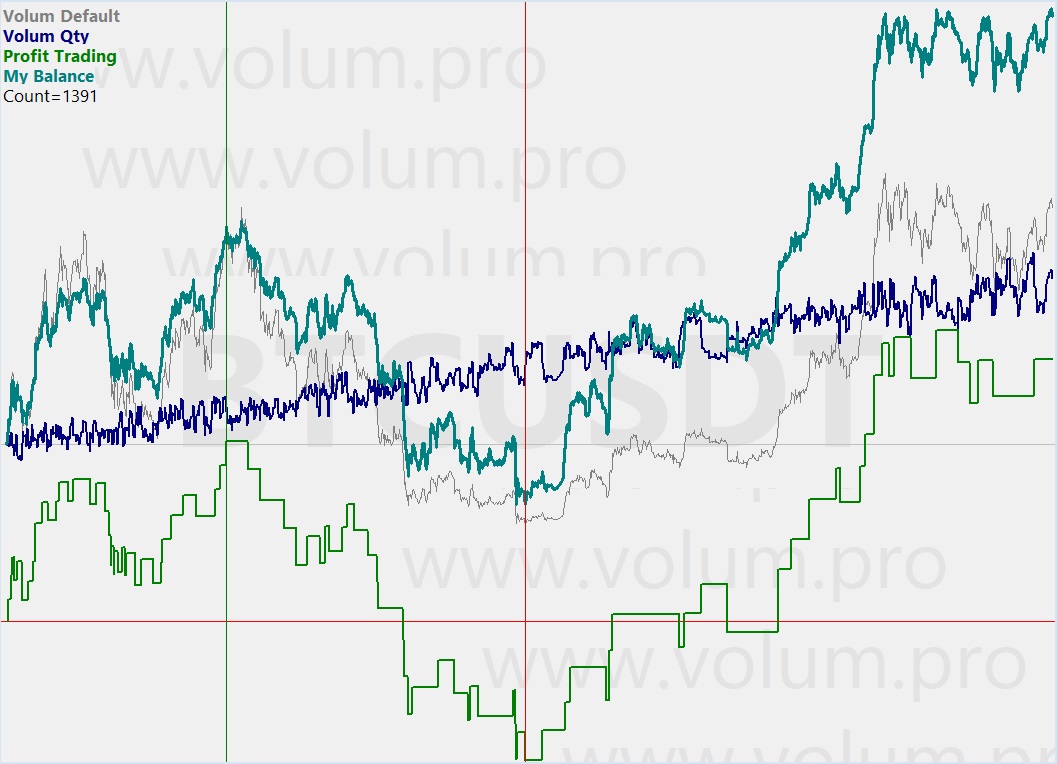
The figure shows four graphs. The thin gray line is the graph of our default balance. That is, during the entire testing period we do not conduct a single transaction, but simply display the value of our current balance. The thin gray horizontal line shows the value equal to 1000 USDT. The green line displays the results of our active trading, the red horizontal line is the zero line. Between the vertical green line and the vertical red line is the maximum drawdown of our trading. The dark blue line is the graph of the current balance. The same balance that we strictly keep in the corridor of plus or minus ten percent. Well, the last graph in turquoise is the graph of our final balance (current balance plus profit on the balance, plus profit on trading). From the graph, it is clear that our trading turned out to be better than the market. It is also clear from the graph that the market is better than our trading only at the moment of a price surge, and worse the rest of the time. A step-by-step description of our trading is presented in the third table. Double-clicking on any line in this table will open the details of what is happening on this candle. Double-clicking on the last line of the table will again open a window with the final results of our trading.
What if you change the Delta and see what happens? What if you sell and buy not the full amount, but partially, for example, the balance has grown by 12 percent and at the same time sell not all 120 USDT, but half? All this is very interesting, but manually sorting through all the options is long and tedious. Therefore, it is possible to automatically try all the options and choose the best one. This can be done with the “Optimization” button. After short calculations, all the optimization results will be summarized in one table, which can be sorted by fields and select the most suitable optimization results. In the lower right corner of the program there are a couple of buttons that expand the testing results and optimization results into a separate large table. There are also buttons for calling up a hint and closing the program. In the upper right corner of the program there are buttons for turning on and off the hint, as well as a button for selecting another language.
It remains to figure out the last field “USDT”. Using this field, you can manually specify the amount by which we plan to increase our zero balance every month. For example, if you specify the number 30 (USDT) in this field, this means that the size of our zero balance will increase by 1 USDT every day. This means that on the second day, the size of our zero balance will not be 1000 USDT, but 1001 USDT, and at the end of the month it will be equal to 1030 USDT. When making a deal at the end of the month, you will need to return to a balance of not 1000 USDT, but 1030 USDT. Thus, when trading on the market, we will increase not only the quoted currency (USDT), but also the base currency (BTC). Now let`s see what the results of our trading will be with a monthly balance increase of 20 USDT.
It is immediately obvious that the total profit has increased by one and a half times (this is good) and the maximum drawdown has also increased by one and a half times (this is bad) and the efficiency of our strategy has increased significantly compared to the market (this is very good). We accept this approach. Now let`s look at the profitability charts.
Here you can immediately see significant changes. The first thing we pay attention to is the dark blue line of our balance. It is slowly but surely growing and by the end of our trading it grows by 947.26 USDT. At the same time, the green trading chart has hardly changed.
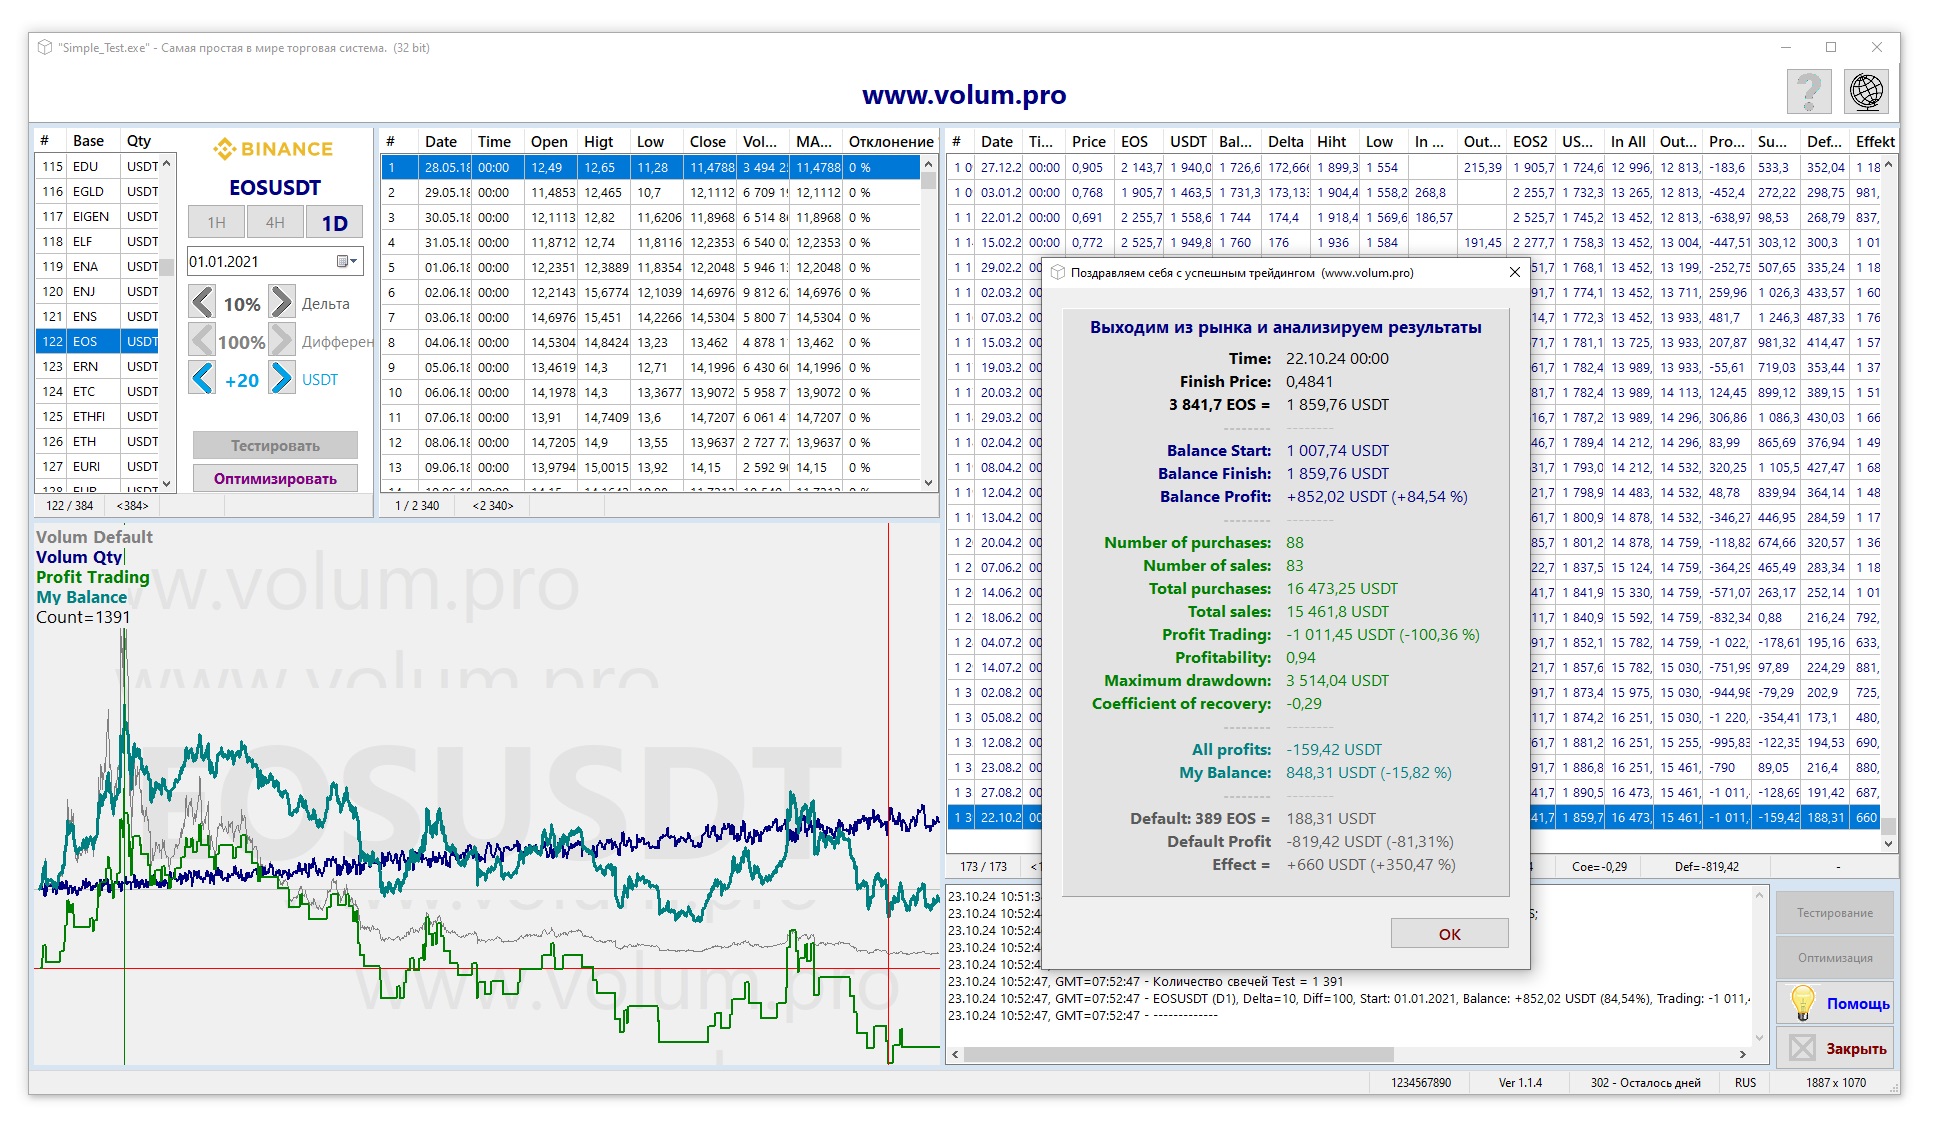
All this is good when the market grows and even without our participation gives a profit of more than 100 percent. But what will our strategy show in a flat market or in a falling market or in a market where there was a price surge and the price returned to its original value? Below are several profitability charts with different market situations. It is immediately obvious that in difficult time periods, when the price falls significantly, our strategy gives a large drawdown. Not everyone can withstand this. To be completely honest, almost everywhere the profit received is approximately equal to the maximum drawdown, and this is a bad indicator of our trading system. Trade on it only if you are ready to accept this.
What conclusion can be drawn from the results obtained? It`s very simple - when the market falls sharply, then buy it back little by little, when the market soars in price, then sell. Add to the market no closer than 10 percent of the last transaction. Likewise, unload the position no closer than the same ten percent. For highly volatile markets, increase the delta to 20 percent or more. Over the long term, you will always be in the black. Yes, this is a long-term investment tactic, but over the long term, it often looks better than the market. You don`t need to devote much time to this strategy. Just look at it once a day and go about your business again. As our first testing shows, in 1391 days we had to make transactions only 94 times. This is an average of two transactions per month. Probably, millionaires trade in this style, and such profit suits them. Trading according to this strategy, you can feel like a millionaire a little.